
- Title
-
Pbx4 is Required for the Temporal Onset of Zebrafish Myocardial Differentiation
- Authors
- Kao, R.M., Rurik, J.G., Farr, G.H., Dong, X.R., Majesky, M.W., Maves, L.
- Source
- Full text @ J Dev Biol
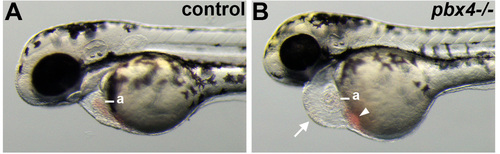
Defective heart development in pbx4 mutant embryos. (A,B) Lateral views of live (A) control and (B) pbx4b557-/- embryos at 50 h post fertilization (hpf). pbx4b557 mutant embryos show pericardial edema (arrow in B) and blood pooled near the atrium (arrowhead in B). a, atrium. For controls, n = 23. pbx4b557 mutant embryos (n = 20) all show similar phenotypes as in (B). Anterior is to the left. PHENOTYPE:
|
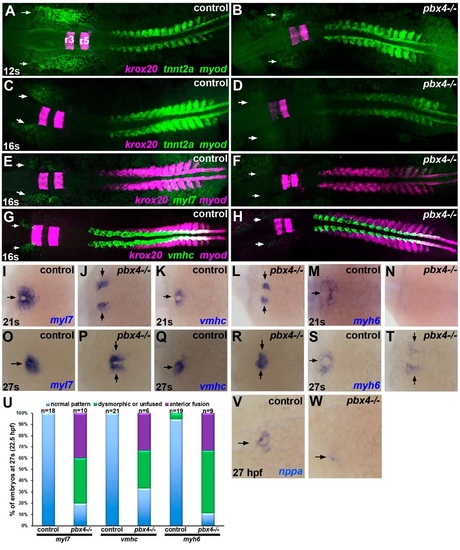
Delayed onset of cardiomyocyte differentiation genes in pbx4 mutant embryos. (A–T, V–W) RNA in situ expression of cardiomyocyte differentiation genes (A–D) tnnt2a, (E–F, I–J, O–P) myl7, (G–H, K–L, Q–R) vmhc, (M–N, S–T) myh6, and (V–W) nppa in (A,C,E,G,I,K,M,O,Q,S,V) control and (B,D,F,H,J,L,N,P,R,T,W) pbx4b557-/- embryos. Developmental stages are indicated. Embryos are shown in dorsal view, anterior towards the left. (A–H) Expression of the Pbx-dependent gene krox20, marking rhombomeres 3 and 5 (r3, r5 in A) in the hindbrain, was included to distinguish between control and pbx4b557-/- mutants [12,19]. Expression of myod, which is expressed in a stripe in each somite plus two additional pre-somitic stripes [38], was included for somite staging. Arrows indicate ALPM expression domains of cardiomyocyte differentiation genes. (A,B) At 12 s, tnnt2a is absent or reduced in pbx4b557-/- embryos (n = 8; 6/8 absent, 2/8 reduced) compared to controls (n = 30; all similar). (C,D) at 16 s, tnnt2a is reduced in pbx4b557-/- embryos (n = 7) compared to controls (n = 28). (E,F) at 16 s, myl7 is absent or reduced in pbx4b557-/- embryos (n = 9; 3/9 absent, 6/9 reduced) compared to controls (n = 22). (G,H) at 16 s, vmhc is absent or reduced in pbx4b557-/- embryos (n = 6; 1/6 absent, 5/6 reduced) compared to controls (n = 10). (I–T) At 21 s and 27 s, myl7, vmhc, and myh6 show delayed fusion and abnormal patterning of expression domains in pbx4b557-/- embryos compared to controls. For (I–N), numbers of affected embryos are provided in the text. For (O–T), numbers of affected embryos are graphed in (U). Arrows indicate expression domains of cardiomyocyte differentiation genes. (U) Graph displaying percentage of embryos at 27 s with either normally patterned (blue), dysmorphic or unfused (green), or anteriorly fused (purple) cardiac primordia. (V–W) At 27 hpf, nppa is reduced in pbx4b557-/- embryos (n = 4, all similar reduced expression) compared to controls (n = 24). Arrows indicate myocardial expression domains. EXPRESSION / LABELING:
PHENOTYPE:
|
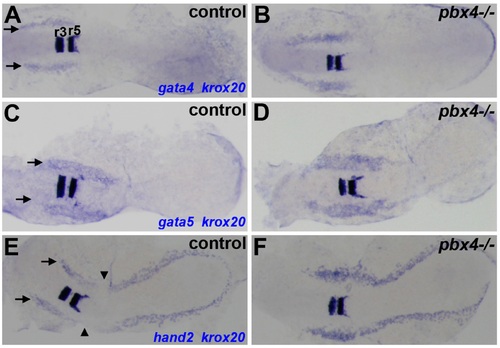
Early cardiomyocyte specification does not appear reduced in pbx4 mutant embryos. (A–F) RNA in situ expression at the 10 s stage of cardiomyocyte specification genes (A–B) gata4, (C–D) gata5, and (E–F) hand2 in the anterior lateral plate mesoderm (ALPM) in (A,C,E) control and (B,D,F) pbx4b557-/- embryos. Expression of the Pbx-dependent gene krox20, marking hindbrain rhombomeres 3 and 5 (r3, r5 in A), was included to distinguish between control and pbx4b557-/- embryos [12,19]. Arrows indicate ALPM expression domains in control embryos. The junction between hand2-expressing ALPM and posterior lateral plate mesoderm domains is noted by arrowheads (E). For (A–D), n e 10 for each marker in pbx4b557-/- embryos and n e 30 for each marker in control embryos, all with similar expression patterns. For (E–F), pbx4b557-/- embryos display expanded hand2 expression (n = 14; 13/14 with expanded expression) compared to control embryos (n = 47; all similar). Embryos are shown in dorsal view, anterior towards the left. EXPRESSION / LABELING:
PHENOTYPE:
|
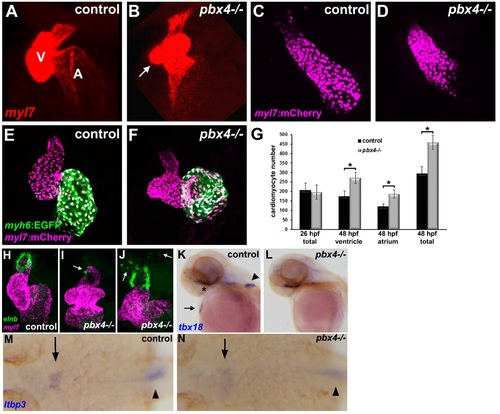
Cardiac chamber, outflow tract, and proepicardial development defects in pbx4 mutant embryos. (A,B) RNA in situ expression of cardiomyocyte differentiation gene myl7 (red) at 48 hpf in (A) control (n = 16) and (B) pbx4b557-/- (n = 4) embryos. V, ventricle. A, atrium. Arrow in (B) points to abnormal bulge in pbx4b557-/- ventricle. (C,D) Cardiomyocyte nuclei (magenta) in 26 hpf Tg(myl7:h2afva-mCherry)sd12 (C) control (n = 13) and (D) pbx4b557-/- (n = 9) embryos. (E,F) Cardiomyocyte nuclei (magenta) in 48 hpf Tg(myl7:h2afva-mCherry)sd12 (E) control (n = 9) and (F) pbx4b557-/- (n = 7) embryos. Tg(myh6:EGFP)s958 (green) is used to identify atrial cells. (G) Graph displaying cardiomyocyte nuclei count data at 26 hpf and 48 hpf. Error bars represent standard deviation. * P < 0.00003. (H,J) RNA in situ expression of outflow tract smooth muscle marker elnb (green) and myl7 (magenta) at 72 hpf in (H) control and (I,J) pbx4b557-/- embryos. In control embryos (n = 15), elnb expression appears as a ring (H). In pbx4b557-/- embryos, elnb expression can appear reduced (arrow in I; 5/9 embryos) or expanded and bifurcated (arrows in J; 4/9 embryos). (K,L) RNA in situ expression of tbx18 at 48 hpf in (K) control and (L) pbx4b557-/- embryos. tbx18 expression in pectoral fin (arrowhead) and proepicardial cells (arrow) is lost in pbx4b557-/- embryos (n = 9) compared to controls (n = 11), while facial expression (asterisk) is maintained. Hearts and embryos are shown in ventral view, anterior toward the top. (M,N) RNA in situ expression of ltbp3 at 24 hpf in (M) control and (N) pbx4b557-/- embryos. ltbp3 expression in second heart field domain (arrows) appears broader yet weaker in pbx4b557-/- embryos (n = 10, all weaker expression) compared to controls (n = 45, all similar), while notochord expression (arrowheads) is maintained. Embryos are shown in dorsal view, anterior towards the left. EXPRESSION / LABELING:
PHENOTYPE:
|

Analysis of Pbx expression during zebrafish cardiac development. (A–G) Pbx immunostaining at (A–B) 10 s (14 hpf), (C–F) 21 s (19.5 hpf), and (G–H) 48 hpf. (A–B) Pbx expression (magenta) in wild type 10 s embryo co-stained with Hoechst to label nuclei (green). (A) Dorsal view, anterior to the left. The line in (A), approximately at the level of hindbrain rhombomere 3, shows where we took an optical cross-section view for (B). Arrows in (B) show Pbx expression in ALPM cells next to the neural tube (nt in A,B). (C–F) Pbx expression (magenta) in Tg(myl7:EGFP)twu34 (green) 21 s (C–D) control embryo and (E–F) pbx4-/- embryo, at low (C,E) and high (D,F) magnification. Arrow in (D) points to cells co-expressing myl7:EGFP and Pbx. Dorsal view, anterior to the left. (G) Pbx expression (magenta) in Tg(myl7:EGFP)twu34 (green) 48 hpf embryo. Ventral view, anterior to the top. V, ventricle. A, atrium. (H–I) Pbx expression (magenta) in wild-type 48 hpf embryo co-stained for proepicardial pan-cytokeratin expression (green) and myocardial cells (MF20, red), at low (H) and high (I) magnification. V, ventricle. Arrows in (H,I) point to two pan-cytokeratin-expressing cells that do not express Pbx, compared to neighboring cardiomyocytes and pan-cytokeratin/Pbx co-expressing cells (arrowheads, I). Scale bar for (A): 100 µm. Scale bar for (B–D): 50 µm. Scale bar for (H): 10 µm. EXPRESSION / LABELING:
|