
- Title
-
Extraembryonic signals under the control of MGA, Max, and Smad4 are required for dorsoventral patterning
- Authors
- Sun, Y., Tseng, W.C., Fan, X., Ball, R., and Dougan, S.T.
- Source
- Full text @ Dev. Cell
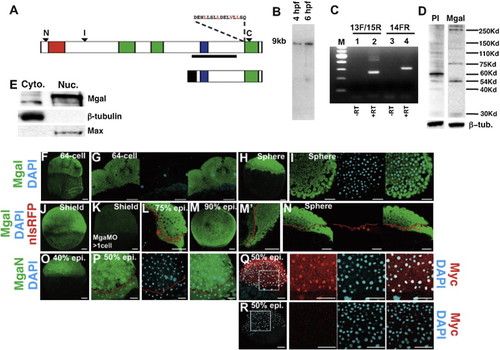
MGA Protein Is Maternally and Zygotically Expressed in All Cells (A) Diagram of full-length MGA protein (top) or a C-terminal MGA fragment consisting of amino acids 2,058–2,735 (bottom). Arrowheads indicate the location of the epitopes for anti-MGA antibodies. A conserved leucine rich nuclear export signal is shown. T-domain (residues 105–285), red; bHLHZip domain (residues 2,093–2,186), blue; Conserved Region 1 (CR1) (residues 938–1,166), CR2 (residues 1,260–1,370), CR3 (residues 2,540–2,715), green; Myc-epitope, black. (B) Northern blot of 4 hpf and 6 hpf embryos for mga transcripts, using the probe indicated by the line in (A). (C) RT-PCR of 8 hpf embryo extracts using primers anchored on either side of exon 14 (13F/15R), or internal to exon 14 (14FR). The lower (260 bp) band in lane 2 lacks exon 14; the upper bands (450 bp and 500 bp) contain exon 14. The 300 bp product in lane confirms the presence of exon 14. (D) Western blot of 8 hpf embryo extracts showing specific bands at 290 kDa and 250 kDa. (E) Western blot of cytoplasmic and nuclear extracts from 8 hpf embryos. (F–P) Confocal images of MGA protein distribution. Embryos were counterstained with DAPI or nls-RFP as indicated, and the boundary between the YSL and blastoderm is marked by a red line in (L), (M2), and (N). (Q and R) Confocal images showing distribution of anti-Myc epitope in embryos injected with C-terminal MGA fragment shown in (A) or uninjected embryos; counterstained with DAPI. Dorsal is to the right in (H), (I), (L), and (L2). At other stages there are no morphological landmarks to determine the orientation. Scale bar represents 50 μm. See also Figure S3. EXPRESSION / LABELING:
|
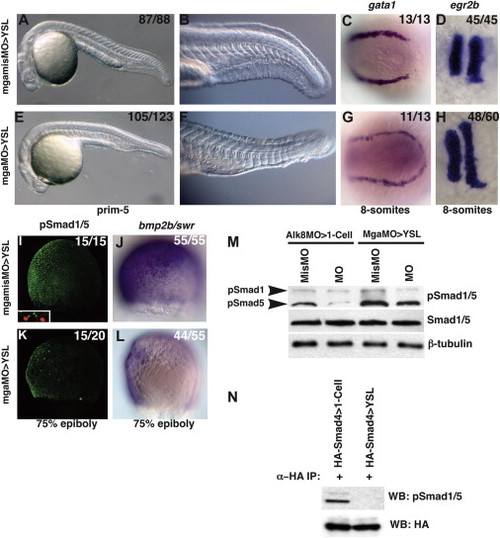
Extraembryonic MGA Controls BMP Signaling in the Embryo Embryos injected into the YSL with 4 ng of a 5 bp mismatch control MO, mgamisMO (A–D, I, J) or 4 ng mgaTL3MO (E–H, K, L). (A, B, E, and F) Live morphants at the prim-5 stage. (C and G) gata1 expression at the 8-somite stage. (D and H) egr2b expression at the 8-somite stage. (I and K) pSmad1/5 gradient at 75% epiboly. The inset (I) shows the YSL nuclei are labeled with nls-RFP. (J and L) bmp2b/swr expression at 75% epiboly. (M) Western blot of extracts of 75% epiboly embryos. In mgaMO>YSL morphants, pSmad1: 48% ± 2.8% SD of controls and pSmad5: 53.5% ± 16.2% SD of controls. In acvr1lMO>1-cell morphants, pSmad1: 25% ± 8.6% SD of controls and pSmad5: 21.25% ± 4.7% SD of controls. (N) Coimmunoprecipitation of HA-Smad4 with pSmad1/5. HA-smad1 mRNA was injected into the whole embryo at the 1-cell stage (lane 1) or into the YSL at 3 hpf (lane 2). Anterior is to the left in (A)–(H). Dorsal is to the right in (I)–(L). In all figures, fractions indicate the number of embryos with the depicted phenotype/total number injected. See also Figures S1 and S2. EXPRESSION / LABELING:
PHENOTYPE:
|
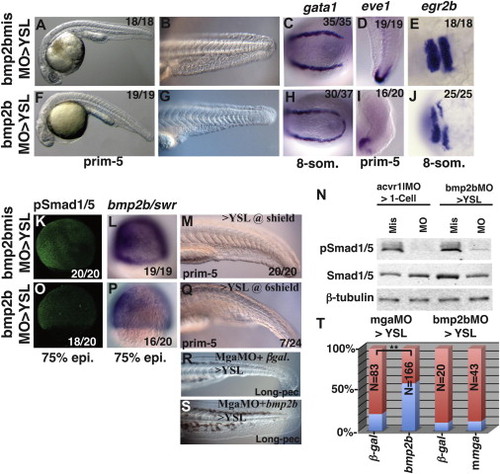
MGA Acts Upstream of Bmp2b/swr in the YSL Embryos injected into the YSL with 1 ng of a 5 bp mismatch control MO, bmpmis2b/swrMO (A–E and K–M), or bmp2b/swrMO (F–J and O–Q). (A, B, F, and G) Live morphants at the prim-5 stage. (C and H) gata1 expression at the 8-somite stage. (D and I) eve1 expression at the prim-5 stage. (E and J) egr2b expression at the 8-somite stage (12 hpf). (K and O) pSmad1/5 gradient at 75% epiboly. (L and P) bmp2b/swr expression at 75% epiboly. (M) Tail region of prim-5 bmp2bmisMO>YSL morphant, injected at shield stage. (N) Western blot of 75% epiboly embryo extracts. In acvr1lMO>1-cell morphants, pSmad1: 25% ± 8.6% SD of controls and pSmad5: 21.25% ± 4.7% SD of controls. In bmp2bMO>YSL morphants, pSmad1: 18% ± 2.8% SD of controls and pSmad5: 19% ± 2.8% SD of control levels. (Q) Tail region of a prim-5 bmp2bMO>YSL morphant, injection at shield stage. (R and S) Live mgaMOTL3>YSL morphant at the Long-pec stage (<48 hpf), coinjected with 25 pg β-galactosidase mRNA (R) or bmp2b mRNA (S). (T) The presence (blue) or absence (red) of the ventral tailfin was scored in mgaMOTL3>YSL morphants injected with 25 pg β-galactosidase mRNA or 25 pg bmp2b/swr mRNA and in bmp2bMO>YSL morphants injected with 100 pg β-galactosidase mRNA or 100 pg mouse mga mRNA. Anterior is to the left in (A)–(C), (E)–(H), (J), (M), and (Q)–(S) and up in (D) and (I). Dorsal is to the right in (K), (L), (O) and (P). p d 0.005. See also Figure S2. EXPRESSION / LABELING:
PHENOTYPE:
|
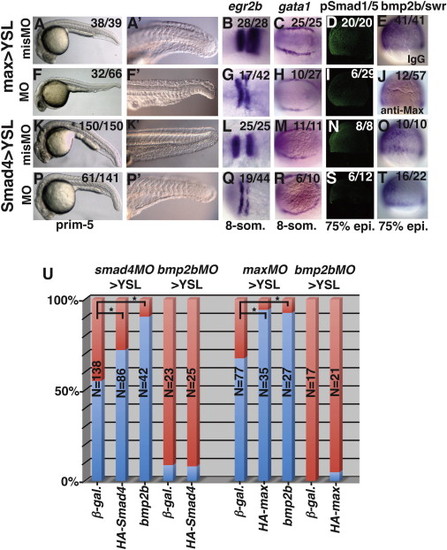
Smad4 and Max Are Required in the YSL for BMP Signaling in the Embryo Embryos injected into the YSL with 8 ng of maxmisMO (A–E), maxMO (F–J), smad4misMO>YSL (K–O), or smad4MO>YSL (P–T). (A, A2, F, F2, K, K2, P, and P2) Image of a live morphants at prim-5. (B, G, L, and Q) egr2b expression at prim-5. (C, H, M, and R) gata1 expression at 8-somites (12 hpf). (D, I, N, and S) pSmad1/5 gradient at 75% epiboly. (E, J, O, and T) bmp2b/swr expression at 75% epiboly. (U) The presence (blue) or absence (red) of the ventral tailfin was scored in smad4MO>YSL morphants injected with 100 pg β-galactosidase mRNA, 100 pg HA-smad4 mRNA, or 25 pg bmp2b/swr mRNA. Tailfin defects (red) were also scored in maxMO>YSL morphants injected with 100 pg β-galactosidase mRNA, 100 pg HA-max mRNA, or 25 pg bmp2b/swr mRNA. Anterior is to the left in (A)–(C), (F)–(H), (K)–(M), and (P)–(R). Dorsal is to the right in (D), (E), (I), (J), (N), (O), (S), and (T). p d 0.05. See also Figures S2 and S5. EXPRESSION / LABELING:
PHENOTYPE:
|

MGA, Max, and Smad4 Are Required Synergistically in the YSL Embryos were injected into the YSL with suboptimal doses of smad4misMO (A–F, M, and N) or smad4MO (G–N) along with 100 pg of IgG (A, B, G, H, and M), 100 pg anti-Max antibody (D, E, J, K, and M), maxmisMO (C, I, M, and N), maxMO (F, L, M, and N), and mgamisMO or mgaMO (N). One nanogram each of MO was injected, except for 2 ng each of MO in (C), (F), (I), (L), and (N). (A, B, D, E, G, H, J, and K) Images of live morphants. (C, F, I, and L) egr2b expression at 8-somites. (M) Frequency of tailfin defects, expanded egr2b expression or expanded gata1 expression (red). (N) Embryos injected with 6 ng MO total (2 ng each MO) and scored at Long-pec according to the dorsoanterior index (Mullins et al., 1996). The key is to the right, and representative embryos from each class are depicted. Due to limited space, only experimental MOs are listed on the x axis, but in each case the applicable control MOs were coinjected so that the total MO dose remained constant. PHENOTYPE:
|
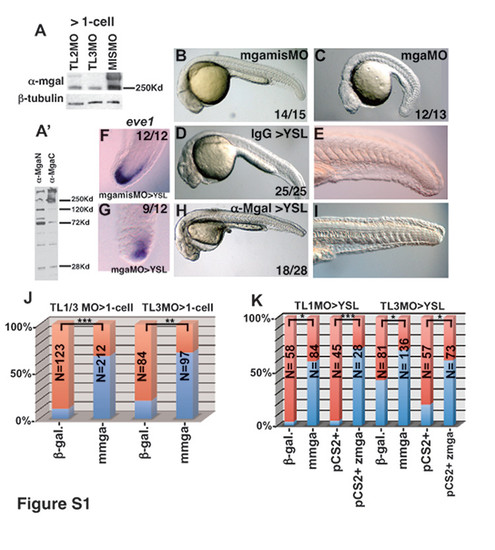
Controls for mgaMOs used in this study, related to Figure 2. (A) Western blot from extracts of 75% epiboly mgaMO>1-cell morphants, probed with anti- MgaI or β-tubulin antibodies. TLMO1 Upper band: 6% ± 0.7 S.D. of control levels, Lower band: 30% ± 3.5 S.D. of control levels (not shown); TLMO2 Upper band: 28% ± 4.2 S.D. of control levels, Lower band: 39% ± 2.1 S.D. of control levels; TLMO3 Upper band: is 5% ± 0.7 S.D. of control levels, short isoform is 29% ± 1.4 S.D. of control levels (not shown). (A′) Western blot from extracts of 75% epiboly wildtype embryos, probed with anti-MgaN or anti-MgaC -6- antibodies. The 250Kd and 290Kd bands are apparent in both lanes. (B, C, D, E, H, I) Image of live embryos at the prim-5 stage (24 hpf), injected at the 1-cell stage with 4ng each of mgamisMOTL3 and p53MO or mgaMOTL3 and p53MO (C, D), or injected into the YSL with 150pg IgG or anti-Max antibody (D, E, H, I). (F, G) eve1 expression in mgamisMO>YSL or mgaMO>YSL morphants. (J) Frequency of embryos with defects shown in panel (C) (red) in mgaTL1/3MO>1-cell morphants or mgaTL3MO>1-cell morphants injected with 50pg mRNA encoding either β-galactosidase or mouse mga mRNA. (K) Frequency of embryos lacking ventral tailfins (red) in mgaTL1MO>YSL morphants or mgaTL3MO>YSL morphants injected either with 50pg mRNA encoding β-galactosidase or mouse mga mRNA, or with 50pg DNA encoding zebrafish mga expressed under control of the CMV promoter or empty vector. Note that the pCS2+ zebrafish mga construct lacks sequences targeted by mgaTLMO3 but contains sequences targeted by mgaTLMO1. The mouse mga mRNA is not recognized by either MO. *pd0.05, **pd0.005, ***pd0.0005. |

Expansion of chordin in YSL morphants, related to Figures 2, 3 and 5. chordin expression in (A) mgamisMO>YSL morphants, (B) mgaMO>YSL morphants, (C) bmp2bmisMO>YSL morphants, (D) bmp2bMO>YSL morphants, (E) 150pg IgG>YSL, (F) 150pg anti-Max>YSL, (G) smad4misMO>YSL morphants, (H) smad4MO>YSL morphants. Dorsal is to the right in all cases. All embryos are at 75% epiboly. |
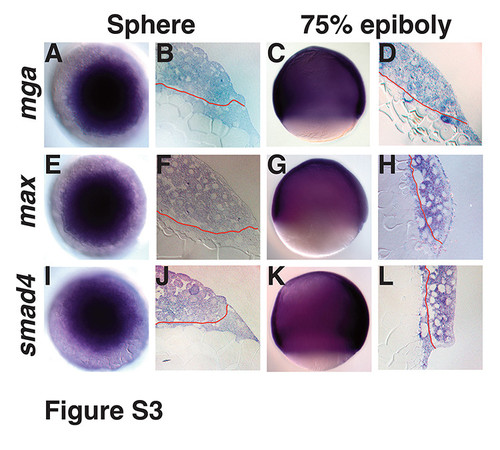
Expression of Mga, Max and Smad4 in the YSL, related to Figures 1 and 4. (A) in situ hybridization for mga at sphere stage in whole mount and (B) in section. (C) in situ hybridization for mga at 75% epiboly in whole mount and (D) in section. (E) in situ hybridization for max at sphere stage in whole mount and (F) in section. (G) in situ hybridization for max at 7hpf in whole mount and (H) in section. (I) in situ hybridization for smad4 at sphere stage in whole mount and (J) in section. (K) in situ hybridization for smad4 at 75% epiboly in whole mount and (L) in section. |
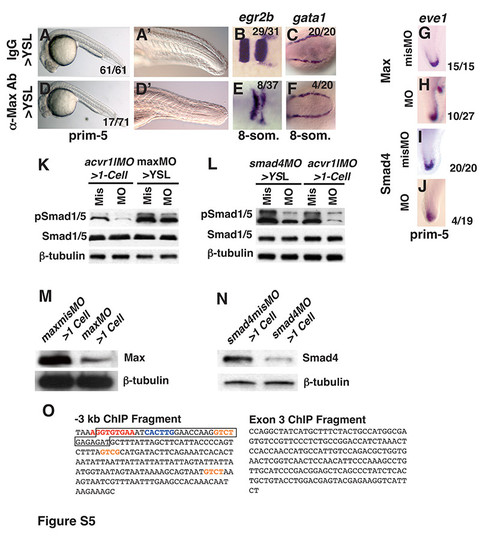
Embryos injected into the YSL with 150pg IgG (A-C), 150pg anti-Max antibody (D-E), 8ng maxmisMO (G, K, M), 8ng maxMO (H, K, M), 4ng smad4misMO (I, L, N) or 4ng smad4MO (J, L, N). (A, A′, D, D′) Image of live embryo at prim-5 (24 hpf). (B, E) egr2b expression at the 8- somite stage. (C, F) gata1 expression at the 8-somite stage. (G, H, I, J) eve1 expression in the tailbud at the prim-5 stage. Arrowhead indicates ectopic tailbud. (K) Western Blot of extracts of embryos at 75% epiboly acvr1lMO>1-cell morphants, maxMO>YSL morphants or controls. In acvr1lMO>1-cell morphants, pSmad1: 25% ± 8.6 S.D. of controls; pSmad5: 21.25% ± 4.7 S.D. of controls; In maxMO>YSL morphants, pSmad1: 56% ± 6.3 S.D. of controls, pSmad5: 70% ± 7.0 S.D. of controls. (L) Western Blot of extracts of embryos at 75% epiboly acvr1lmisMO>1-cell morphants, smad4MO>YSL morphants, or controls. In acvr1lMO>1-cell morphants, pSmad1: 25% ± 8.6 S.D. of controls; pSmad5: 21.25% ± 4.7 S.D. of controls; In smad4MO>YSL morphants, pSmad1: 23% ± 3.5 S.D. of controls, pSmad5: 35% ± 0.7 S.D. of controls. (M) Western blot of maxMO>1-cell morphants or controls. Max protein: 19.7% ± 7.3 S.D. of controls. (N) Western blot of extracts of 8hpf smad4MO>1-cell morphants or controls. Smad4 protein: 20% ± 2.1 S.D. of controls. (O) The sequences of the amplicons assayed in Fig. 7A. Consensus Tbox site is in red; consensus E-box site is blue; potential Smad binding sites are orange. Anterior is to the left in (A-F), to the top in (G, H, I, J). For Western blots, 15μg total protein loaded in each lane. |
Reprinted from Developmental Cell, 28(3), Sun, Y., Tseng, W.C., Fan, X., Ball, R., and Dougan, S.T., Extraembryonic signals under the control of MGA, Max, and Smad4 are required for dorsoventral patterning, 322-334, Copyright (2014) with permission from Elsevier. Full text @ Dev. Cell