- Title
-
Hadp1, a newly identified pleckstrin homology domain protein, is required for cardiac contractility in zebrafish
- Authors
- Wythe, J.D., Jurynec, M.J., Urness, L.D., Jones, C.A., Sabeh, M.K., Werdich, A.A., Sato, M., Yost, H.J., Grunwald, D.J., MacRae, C.A., and Li, D.Y.
- Source
- Full text @ Dis. Model. Mech.
|
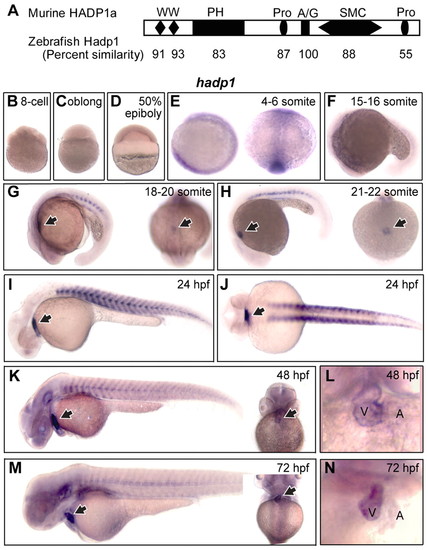
Expression of hadp1, a newly identified PH-domain family gene, is enriched in the embryonic zebrafish heart. (A) Predicted secondary structure of murine HADP1 with the percent amino acid similarity of zebrafish Hadp1 shown below. WW, WW motif; PH, pleckstrin-homology domain; Pro, proline-rich region; A/G, ATP/GTP-binding motif A; SMC, ATP-binding cassette/structural maintenance of chromosomes family ATPase domain. (B–N) Whole mount in situ hybridization for hadp1 in zebrafish. (B–D,F,I) Lateral view; (E) lateral view on left and dorsal view on right; (G,H) lateral view on left and anterior view on right; (J) dorsal view; (K,M) lateral view on left and ventral view on right; (L,N) close-up of ventral view. The heart is indicated with an arrow (G–K,M). The ventricle (V) and atrium (A) are indicated. EXPRESSION / LABELING:
|
|
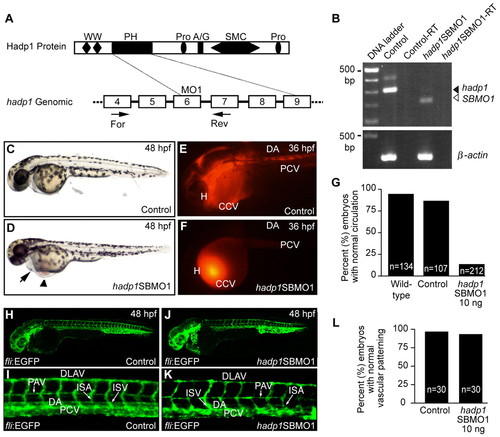
Knockdown of hadp1 decreases cardiac output and contractility in zebrafish. (A,B) Schematic representation of Hadp1 protein (top) and partial genomic structures (bottom; boxes represent coding exons), with positions of the MO and RT-PCR primers indicated. See Fig. 1 for abbreviations. (B) RT-PCR analysis of control and morphant embryos. β-actin is a loading control. –RT indicates the absence of reverse transcriptase as a negative control. (C,D) Brightfield images of live embryos (anterior is to the left) after injection with 10 ng control MO or 10 ng SBMO1. Arrow and arrowhead indicate pericardial effusion and blood pooling, respectively. (E,F) Microangiography following injection of control MO or SBMO1 reveals that circulation is altered following knockdown of hadp1. Heart (H), common cardinal vein (CCV), dorsal aorta (DA) and the posterior cardinal vein (PCV) are indicated. Circulation was scored by microangiography, or under transmitted light, and the results are quantified in G. (H–K) Confocal micrographs of control MO or SBMO1 morphant fli:EGFP transgenic embryos. Dorsal aorta (DA), posterior cardinal vein (PCV), parachordal vein (PAV), intersegmental arteries (ISA), intersegmental vessel (ISV) and dorsal longitudinal anastomotic vessel (DLAV) are indicated. (L) Quantification of normal vascular patterning. |
|
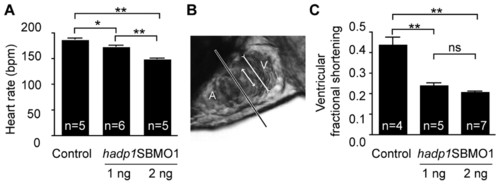
Loss of hadp1leads to bradycardia and hypocontractility. (A) Heart rate analysis (bpm) in control and hadp1 morphants at 48 hpf and 21°C. (B) Live, lateral image of a 48-hpf zebrafish heart. The longest line represents the demarcation between the atrium (A) and ventricle (V), whereas the long line in the ventricle represents the end diastolic, or largest area, of the ventricular chamber and the shorter line represents the end systolic, or smallest, ventricular area. The ratio of these two measurements defines ventricular fractional shortening. (C) Analysis of ventricular fractional shortening following loss of hadp1. See supplementary material Movies 3, 4 and 5 for the absence of edema, unlike SBMO1 (10 ng)-injected animals (as shown in Fig. 2 and supplementary material Movies 1 and 2). *Pd0.05; **Pd0.005; ***Pd0.001; ns, not significant. PHENOTYPE:
|
|
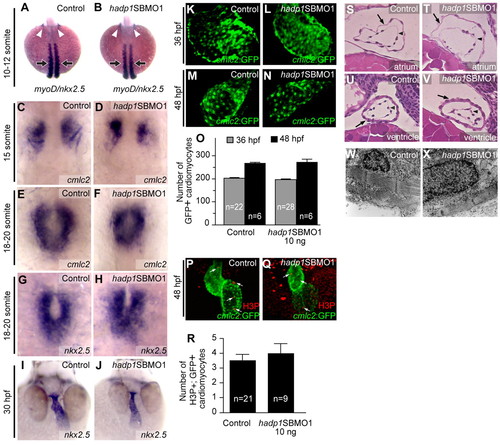
Cardiogenesis is not altered in hadp1 morphants. (A,B) Early specification of the heart field was analyzed by in situ hybridization for nkx2.5 at the 10- to 12-somite stage. Arrowheads indicate nkx2.5 expression. Embryos were stage-matched according to somite number as determined by myoD staining (indicated by the arrows). (C,D) Specification was also examined by in situ hybridization for cmcl2 at the 15-somite stage. (E–H) Migration of cardiomyocytes to the midline was examined in 18- to 20-somite-stage embryos following loss of hadp1 by in situ hybridization for cmlc2 (E,F) and nkx2.5 (G,H). (I,J) Heart-tube elongation and extension was assessed in 30-hpf control and hadp1 morphant embryos by in situ hybridization for nkx2.5. (K–N) Direct immunofluorescence (K,L) and confocal microscopy (M,N) of cmlc2:GFP hearts from 36 hpf (K,L) and 48 hpf (M,N) control and hadp1 morphant embryos. (O) The number of GFP+ cells was quantified. (P,Q) Confocal analysis of vibratome sectioned hearts following immunostaining for H3P and GFP in 48-hpf control (P) and hadp1 morphant (Q) embryos. (R) The number of double-positive (H3P+, GFP+; i.e. proliferating cardiomyocytes) was quantified. (S–V) Coronal sections through the heart at 48 hpf, stained with hematoxylin and eosin, anterior to the top. Arrow and arrowhead indicate myocardium and endocardium, respectively. (S,T) Comparison of sections through the atrium of control (S) and hadp1 morphant (T) embryos. (U,V) Comparison of sections through the ventricle of control (U) and hadp1 morphant (V) embryos. (W,X) Coronal section at 48 hpf through cardiomyocytes viewed by TEM. Cardiomyocytes in control (W) and hadp1 morphant (X) ventricles contain organized myofibrillar arrays. EXPRESSION / LABELING:
PHENOTYPE:
|
|
Non-chamber myocardium fails to differentiate properly in hadp1 morphants. (A–J) Frontal views at 48 hpf (head to the top) illustrate expression of chamber-specific genes in control and hadp1 morphant embryos. (A,B) atrial myosin heavy chain (amhc; red; atrial marker) and ventricular myosin heavy chain (vmhc; purple; ventricular marker) were visualized by double in situ hybridization. (C,D) MF20 (red) and S46 (green) were visualized by whole mount immunofluorescence. (E,F) bmp4 expression was examined by in situ hybridization. Ventricle (V), atrium (A) and outflow tract (OFT) are indicated. Arrows indicate the AV boundary, and the dotted line demarcates the cardiac silhouette. (G,H) Immunofluorescence was used to study cmlc2:GFP (green) and DM-GRASP (red) expression. Arrows and arrowheads indicate myocardium and endocardium, respectively. (I,J) Confocal analysis of the AV canal of control (I) and hadp1 morphant (J) hearts shown in G,H. The superior (sup) and inferior (inf) aspects of the canal are shown, and remodeled trapezoidal cells are indicated with asterisks, whereas non-remodeled columnar cardiomyocytes are indicated with plus signs. Arrows and arrowheads indicate myocardium and endocardium, respectively. (K,L) notch1b expression was examined by in situ hybridization. Ventricle (V) and atrium (A) are indicated. Arrows indicate the AV boundary. |
|
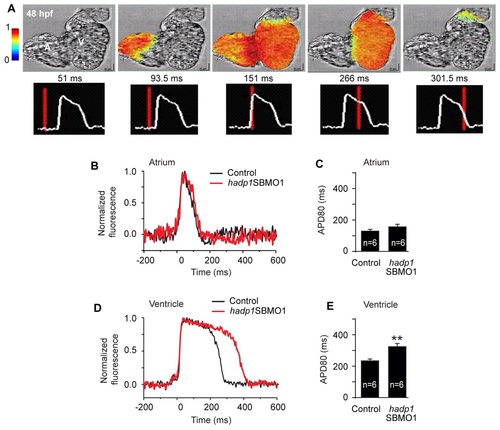
Ventricular cardiac electrical action potentials are affected in hadp1 morphants. (A-E) Optical mapping of voltage activation in the zebrafish heart. (A) Sequential images of an ex vivo wild-type heart at 48 hpf show the initiation of an electrical impulse from the sinoatrial (SA) node (left-side), as illustrated by the increased color in the left-most panel. Serial images show the propagation of electrical activation across the heart, through the atrium to the AV node, to the ventricle, and through the outflow tract. Lower panels, corresponding to those above, show the morphology of ventricular fluorescence during the course of a single round of impulse propagation. (B) Representative traces of action potentials from single sites in the atrium of control (black) and hadp1 morphants (red). The atrial action potential duration (APD80) is quantified in C. (D) Representative traces of action potentials from single sites in the ventricle of control (black) and hadp1 morphants (red). The ventricular action potential duration (APD80) is quantified in E. PHENOTYPE:
|
|
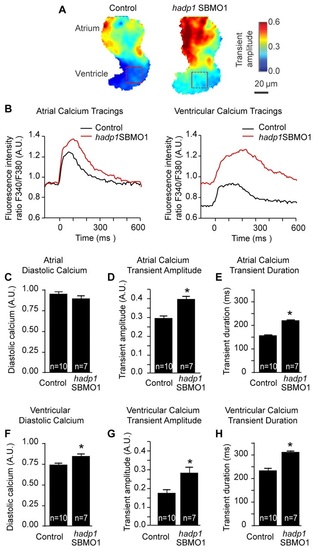
Ca2+ transient duration is altered following loss of hadp1. (A-H) Optical mapping and quantification of Ca2+ transients in the embryonic zebrafish heart. (A) Representative images of the mean Ca2+ transient amplitude following optical mapping, using the ratiometric dye Fura-2, in control and hadp1 morphant hearts. The red box denotes an example of the pixel areas that were sampled for quantification of ventricular transients. The far-right scale indicates the transient amplitude intensity. (B) Representative traces of Ca2+ transients from single sites in the atrium and ventricle of control (black) and hadp1 morphants (red). (C-E) Quantification of the atrial diastolic Ca2+ (C), transient amplitude (D) and transient duration (E). (F-H) Quantification of the ventricular diastolic Ca2+ (F), transient amplitude (G) and transient duration (H). PHENOTYPE:
|
|
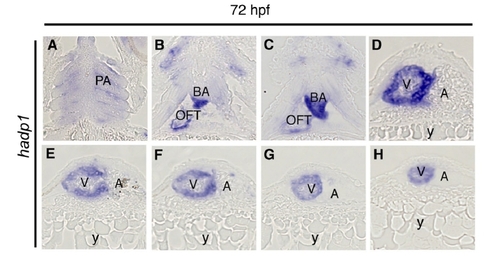
Late expression of hadp1 is restricted to the myocardium of the zebrafish heart. (A-H) Serial coronal sections, ventral view, of a 72 hpf zebrafish embyo following whole mount in situ hybridization for hadp1, V=ventricle, A=atrium, y=yolk, BA=bulbous arteriosous, OFT=outflow tract, PA=pharangeal arches. |
|
Hadp1 is expressed in the developing mouse heart. Whole mount in situ hybridization of (A) 8-12 somite stage, unturned mouse embryos (ventral and dorsal views) (B) 5-18 somite stage embryos, and (C) 26-28 somite stage embryos. (D) Magnification of the heart of (C), A=atrium, OFT=outflow tract, RV=right ventricle, LV- left ventricle, (E) Coronal section, following in situ hybridization for Hadp1, of 26-28 somite stage embryos, counterstained with Nuclear Fast Red. |
|
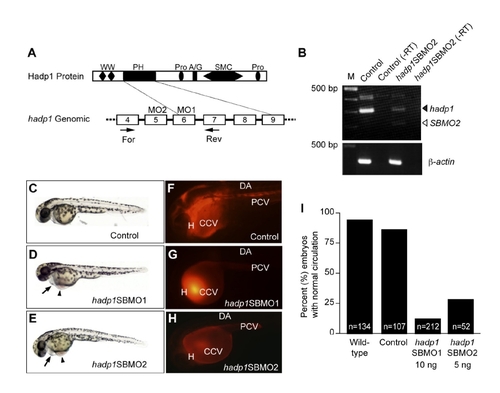
Knockdown by a second, non-overlapping MO decreases levels of WT hadp1 mRNA and results in similar circulation defects as hadp1SBMO1. (A-B) Schematic representation of Hadp1 protein and partial genomic structure (boxes represent coding exons), with positions of the MO and RT-PCR primers indicated. (B) Agarose gel images show RT-PCR results for hadp1 message and β-actin as a loading control. -RT indicates RT without reverse transcriptase as a negative control. DNA ladder sizes are indicated in basepairs. (C-E) Brightfield images of live embryos anterior to left show overall trunk morphology in control (10 ng control MO) and hadp1 morphants (10 ng hadp1SBMO1, 5ng hadp1SBMO1, hadp1SBMO2). (F-H) Microangiography was performed following injection of hadp1SBMO1, hadp1SBMO2 or control MO. Circulation was scored by microangiography, or under transmitted light, and the results are quantified in (I). All embryos are imaged from a lateral view, anterior to left. The heart (H), common cardinal vein (CCV), dorsal aorta (DA), and posterior cardinal vein (PCV) are indicated. PHENOTYPE:
|
|
Hadp1a and Hadp1b are both localized to the plasma membrane. HEK 293 cells were transiently transfected with myc-epitope tagged Hadp1a-myc (A) or Hadp1b-myc (B), and 36 h later processed for indirect immunofuorescence with an antibody recognizing myc and TOPRO3 to label the nucleus. |

Unillustrated author statements PHENOTYPE:
|

