
- Title
-
Extensive scar formation and regression during heart regeneration after cryoinjury in zebrafish
- Authors
- González-Rosa, J.M., Martín, V., Peralta, M., Torres, M., and Mercader, N.
- Source
- Full text @ Development
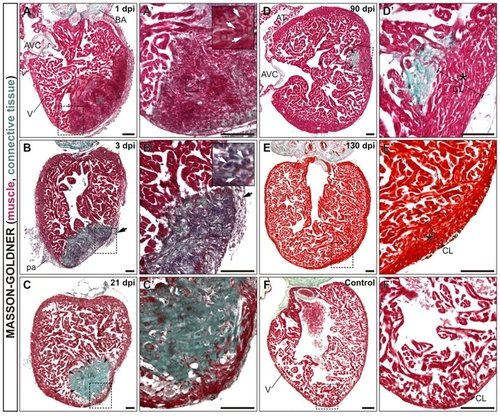
Complete regeneration and scar removal after cryoinjury of the adult zebrafish ventricle. Masson-Goldner-Trichrome stained sagittal sections of adult zebrafish heart fixed at the indicated days after cryocauterization of 25% of the ventricular apex. Anterior is towards the top, ventral towards the right. Boxed areas of the cauterized region are shown at higher magnification in A2-F2. The staining reveals deposition of connective tissue and fibrotic areas in green and healthy myocardial tissue in red. (A,A2) At 1 dpi, there is still some trabeculated myocardium in the injured area (IA). Erythrocytes accumulate at the IA (white arrows in inset). (B,B2) Extensive fibrosis is visible at the IA at 3 dpi. The myocardium has been degraded by this stage. Note the infiltration of the IA with inflammatory cells (white arrows in inset). Black arrows in B and B2 indicate the thickened epicardial layer at 3 dpi. (C,C2) At 21 dpi the compact layer has regenerated and the IA is positioned at a more luminal region. (D,D2) Only a small remnant of the IA is visible at 90 dpi, positioned at the border between compact and trabeculated layers. (E,E2) At 130 dpi, regeneration is complete. Note the enlarged myocardial compact layer near the injury site at 90 dpi (D,D2, asterisk) and 130 dpi (E,E2, asterisk) compared with the control situation (F,F2). Arrows in all panels indicate fibrotic tissue accumulation. AT, atrium; AVC, atrioventricular channel; BA, bulbus arteriosus; CL, compact layer; dpi, days post-injury; IA, injured area; pa, pericardial adhesions; V, ventricle. Scale bars: 100 μm. |

Comparison of collagen deposition and removal dynamics in cauterized and resected hearts. (A-F) Picro-Mallory stained sagittal sections of adult zebrafish heart fixed at the indicated days after cryocauterization (A-C) or resection (D-F) of the ventricular apex. Collagen is stained blue, damaged tissue in red and myocardium in brown. (A2-F2) Boxed areas of the damaged region shown at higher magnification. Anterior is towards the top, ventral towards the right. The strong collagen staining at the bulbus arteriosus acts as a positive control. (A-C2) Massive collagen deposition can be observed upon cauterization, which persists until late stages, indicating the formation of a scar. (D-F2) Resection triggers less collagen deposition than observed upon cryoinjury. Although a collagen scar persists until late stages after cauterization (C), it completely disappears after resection (F,F2). Arrowheads indicate sites of collagen deposition. BA, bulbus arteriosus; dpa, days post-amputation; dpi, days post-injury; IA, injured area; V, ventricle. Scale bars: 100 μm. |
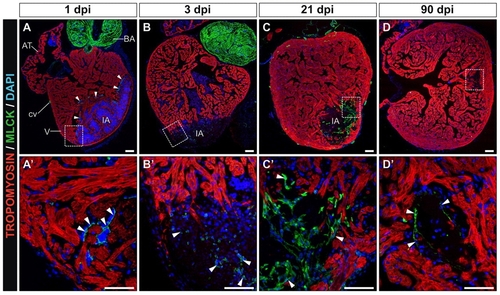
Cryocauterization-induced myofibroblast accumulation and subsequent elimination during scar removal. (A-D) Immunohistochemistry on sagittal sections of cauterized hearts on the indicated days post-injury with antibodies to tropomyosin (red) and myosin light chain kinase (Mlck) (green); nuclei are stained with DAPI (blue). Anterior is towards the top, ventral towards the right. (A2-D2) Higher magnification views of the boxed areas in A-D. Arrowheads indicate Mlck-positive cells. (A,A2) Note the accumulation of Mlck at the borders of the injured region at 1 dpi, revealing activated thrombocytes. (B,B2) At 3 dpi, some Mlck-positive cells appear at the injury site. (C,C2) At 21 dpi, a Mlck-positive scar has formed, which partially persists until late stages of regeneration. (D,D2) At 90 dpi, only a few Mlck-positive cells can be detected in the scarred region. AT, atrium; BA, bulbus arteriosus; cv, coronary vessel; dpi, days post-injury; IA, injured area; V, ventricle. Scale bars: 100 μm. |
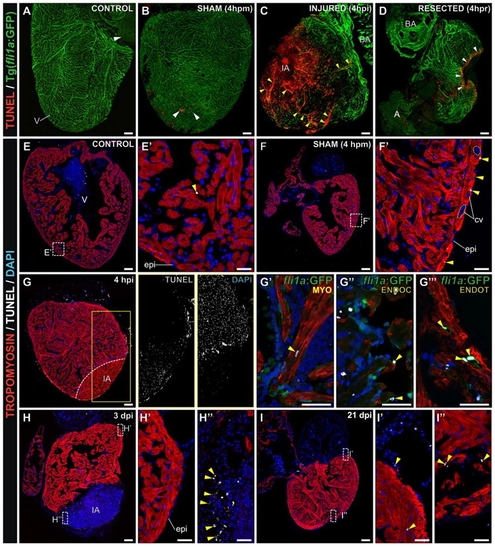
Cryocauterization induces extensive cardiac apoptosis. (A-D) Confocal 3D projections of whole-heart TUNEL staining of Tg(fli1a:GFP) zebrafish, in which the endocardium and vascular endothelium are revealed by GFP immunohistochemistry. White arrowheads indicate TUNEL-positive cells. (A) Untreated (control) heart revealing few TUNEL-positive cells. (B) Sham-operated heart, revealing a slight increase in apoptosis in response to pericardial sac rupture at 4 hours post-manipulation (4 hpm). (C) Cryocauterized heart. Massive cell death is evident at the injury site and also in the vascular lumen of coronary vessels far from the injured area at 4 hours post-injury (4 hpi). Yellow arrowheads indicate TUNEL-positive capillaries. (D) Resected heart. Ventricular resection provokes apoptosis in a small area close to the amputation plane. (E-I3) TUNEL staining (white) and immunohistochemistry against tropomyosin (red) and GFP (green) on sagittal heart sections. Nuclei are stained with DAPI (blue). Yellow arrowheads indicate TUNEL-positive cells. (E,E2) Few apoptotic cells are detected in control hearts. (F,F2) In sham-operated hearts at 4 hpm, increased numbers of apoptotic cells are observed in the epicardium but not in the coronary vessels (F2, highlighted with broken lines). (G-G32) In cryocauterized hearts at 4 hpi, extensive cell death is visible at the injury site (compare adjacent panels in G showing greyscale images of TUNEL and DAPI stainings). Although tropomyosin staining is still present in the injured area (IA), DAPI and TUNEL staining reveal that these are enucleated cardiomyocytes undergoing cell death. (G2-G4) Higher magnification views of the boxed area in G, revealing a TUNEL-positive cardiomyocyte in the IA (G2), TUNEL-positive endocardial cells in the IA (G3) and TUNEL-positive vascular endothelial cell nuclei in the proximity of the IA (G4). (H-H3) At 3 dpi, apoptosis decreased in coronary endothelial cells and epicardium of the periphery (H2), while apoptotic cells can be found within the IA (H3). (I-I3) At 21 dpi apoptosis has generally decreased (I2) and apoptotic cells concentrate at the IA borders (I3). A, atrium; BA, bulbus arteriosus; dpm, days post-manipulation; dpi, days post-injury; epi, epicardium; hpm, hours post-manipulation; hpi, hours post-injury; hpr, hours post-resection; IA, injured area; V, ventricle. Anterior is towards the top, ventral towards the right in all panels. Scale bars: general view, 100 μm; higher magnification views, 25 μm. |
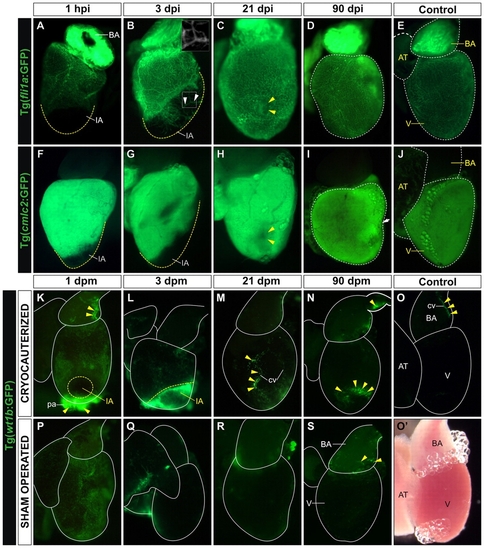
Cardiac tissue regeneration upon cryocauterization. (A-D,F-I) Whole-mount views of dissected hearts of Tg(fli1a:GFP) zebrafish (indicating endocardium and vascular endothelium; A-D) and Tg(cmlc2:GFP) zebrafish (indicating myocardium; F-I) at the indicated times post-injury (hpi or dpi). (E,J) Untreated controls. Anterior is towards the top, ventral towards the right. Broken yellow lines demark the injured area (IA) or the nonregenerated remnant of the IA. (A) Upon cryoinjury, the coronary vasculature and endocardium are completely devoid of GFP expression. (B) At 3 dpi, the IA becomes vascularized (indicated by arrowheads and highlighted in inset box). (C) At 21 dpi, the IA (yellow arrowheads) is nearly indistinguishable from surrounding tissue. (D) By 90 dpi, GFP expression in cryoinjured hearts is similar to control Tg(fli1a:GFP) hearts. (F,G) Lack of myocardial GFP expression in the IA after cryocauterization. (H) Recovery of myocardial GFP expression at 21 dpi; note the small GFP-negative region in the myocardium (yellow arrowheads), possibly a remnant of the IA. (I) By 90 dpi, myocardial GFP expression in cryoinjured hearts is similar to that in control Tg(cmlc2:GFP) hearts. The arrow and broken lines in D and I indicate major long-term morphological alterations in ventricular shape after injury, compared with controls (E,J). (K-S) Whole-mount views of dissected hearts of Tg(wt1b:GFP) zebrafish (indicating epicardium) in cryocauterized hearts (K-N), control hearts (O,O2) and sham-operated hearts (P-S). Yellow arrowheads mark sites of GFP expression. (K) Upon injury, GFP expression is activated on the surface of the heart and pericardium. (L) Expression remains high at 3 dpi, especially close to the IA. (M,N) GFP expression is downregulated at later stages but is still visible at the borders of the IA and in association with coronary vessels. (O) Non-injured control heart revealing just a few GFP-positive cells in the bulbus arteriosus. (O2) Bright-field image of the same heart as in O. (P) Sham-operated heart revealing GFP expression in the epicardium. (Q-S) At 3 dpm, GFP expression is already downregulated and remains low at all later stages analyzed. AT, atrium; BA, bulbus arteriosus; cv, coronary vessel; IA, injured area; V, ventricle. |

Ventricular cryocauterization induces a proliferative response in cardiac cells. Immunostaining of sagittal Tg(fli1a:GFP) heart sections for myosin heavy chain (MHC, red), GFP (green) and proliferating cell nuclear antigen (PCNA; white). Nuclei are stained with DAPI (blue). Proliferating (PCNA-positive) cells are indicated with yellow arrowheads. Anterior is towards the top, ventral towards the right. (A,A2) Untreated (control) heart revealing few proliferating cells. (B,B2) Sham-operated heart; pericardial sac opening leads to a limited increase in cell proliferation in the epicardium. (C-C4) Cryoinjured heart at 3 dpi. (C2) Extensive proliferation is detected away from the injured area (IA) in epicardium, cardiomyocytes and endocardial cells. White arrows indicate proliferating vascular endothelium. Inset shows a detailed view of proliferating endothelial cells (yellow arrows indicate PCNA-positive nuclei). (C3) In the trabeculated myocardium bordering the IA, both cardiomyocytes (yellow arrowheads) and endocardial cells (white arrows) are highly proliferating. (C23) PCNA-positive cardiomyocytes in the compact layer are indicated by yellow arrowheads. (D) Cryoinjured heart at 21 dpi. Asterisk indicates the IA. (D2) Only a few proliferating cells are detected in the periphery (white arrows indicate coronary endothelial cells). (D3) Few proliferating cells (yellow arrowheads) are found close to the IA. (E-G) Quantification of proliferating vascular endothelial cells, endocardial cells and cardiomyocytes in control (C), sham-operated (3d-S) and cauterized hearts at regions close to (3d-IA) or distant from (3d-P) the injured area at 3 dpm. For each condition, PCNA-positive cells were counted in three to five hearts (at least two sections per heart). Data are mean±s.d.; *P<0.05; **P<0.01; ***P<0.001 (one-way ANOVA followed by Tukey′s honest significant difference test). AT, atrium; BA, bulbus arteriosus; cv, coronary vessel; dpm, days post-manipulation; dpi, days post-injury; epi, epicardium; IA, injured area; pa, pericardial adhesion. Scale bars: general view, 100 μm; higher magnification views, 50 μm. |
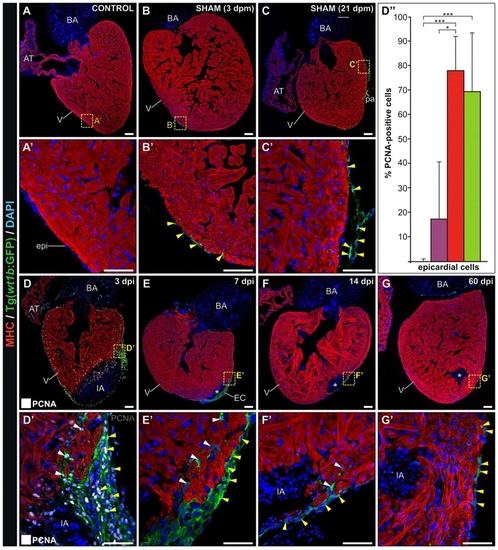
Ventricular cryocauterization induces a proliferative response in epicardial cells. Immunostaining of sagittal Tg(wt1b:GFP) heart sections for myosin heavy chain (MHC) (red) and GFP (green). Nuclei are stained with DAPI (blue). Proliferating (PCNA-positive) cells are indicated with yellow arrowheads. Anterior is towards the top, ventral towards the right. Asterisks indicate the injured area (IA). Yellow arrowheads indicate GFP-positive cells in the epicardium. White arrowheads indicate GFP-positive cells in the compact layer. (A,A2) Untreated (control) heart revealing no GFP-positive cells. (B,B2) Sham-operated heart at 3 dpm; pericardial sac opening leads to GFP expression in epicardial cells. (C,C2) At 21 dpm, some GFP-positive cells are found in the epicardium. (D,D2) Cryoinjured heart at 3 dpi; proliferating (PCNA-positive) cells are shown white. Extensive proliferation is detected in the epicardium, especially at the borders of the IA. (D2) Nearly all GFP-positive cells are proliferating at this stage. The epicardial layer is several cell diameters thick. GFP-positive cells can also be found protruding into the compact layer. (D3) Quantification of proliferating epicardial cells in control sham-operated (violet) and cauterized hearts at regions close to (red) or distant from (green) the injured area at 3 dpm. For each condition, PCNA-positive cells were counted in three to five hearts (at least two sections per heart). Data are mean±s.d.; **P<0.01; ***P<0.001 (one-way ANOVA followed by Tukey′s honest significant difference test). (E,E2) At 7 dpi, GFP-positive epicardial cells cover the IA. (F,F2) Cryoinjured heart at 14 dpi; note the reduced thickness of the epicardial cap compared with earlier stages. (G,G2) Cryoinjured heart at 60 dpi. GFP-positive cells can also be found covering the remnants of the IA, although the epicardial layer has returned to its normal thickness of one cell diameter. AT, atrium; BA, bulbus arteriosus; dpi, days post-injury; dpm, days post-manipulation; epi, epicardium; IA, injured area; pa, pericardial adhesion. Scale bars: general view, 100 μm; higher magnification views, 50 μm. |
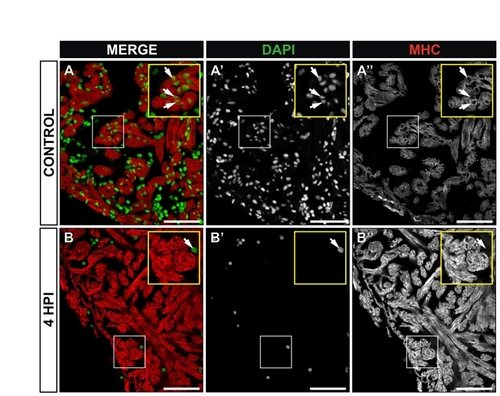
Enucleated cardiomyocytes at 4 hpi. Immunohistochemistry on sections of control (A-A22) or cryoinjured zebrafish hearts at 4 hours post-injury (hpi) (B-B22). Myocardial cells are revealed by staining for myosin heavy chain (MHC, red) and cell nuclei are stained with DAPI (green). (A-A22) In control hearts, nucleated cardiomyocytes are detected in the compact and trabeculated myocardium (see magnified view in the inset). Arrows indiacte examples of nucleated cardiomyocytes. (B-B22) At 4 hpi, DAPI staining is lost to a great extent (B2), while MHC distribution is not affected (B22). Yellow insets show a higher magnification view of boxed area. A DAPI-positive cell in the lumen of the IA is shown (arrow). Note that neighboring cardiomyocytes do not contain nuclei. HPI, hours post-injury. Scale bars: 50 μm. |
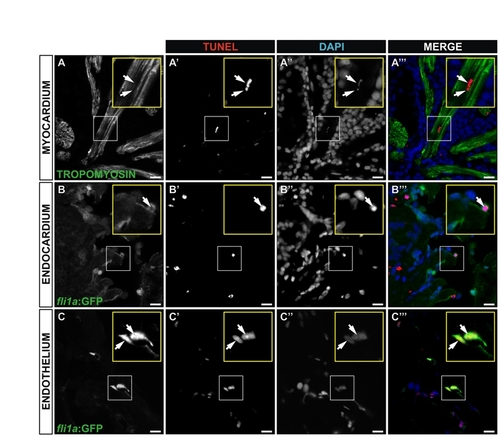
Cell death at 4 hours post-injury (4 hpi). (A-C222) Immunohistochemistry and TUNEL staining on sagittal sections of an adult Tg(fli1a:GFP) heart 4 hpi. Sections are the same as those shown in Fig. 4G-G222. Myocardial cells are revealed by staining for tropomyosin; endocardial and vascular endothelial cells by staining for GFP. Cell nuclei are stained with DAPI. Single channels and merged images are shown for representative TUNEL-positive cardiomyocyte (A-A222), endocardial cell (B-B222) and vascular endothelial cells (C-C222). Yellow insets show a higher magnification views of boxed areas. Arrows indicate TUNEL-positive nuclei. Scale bars: 10 μm. |
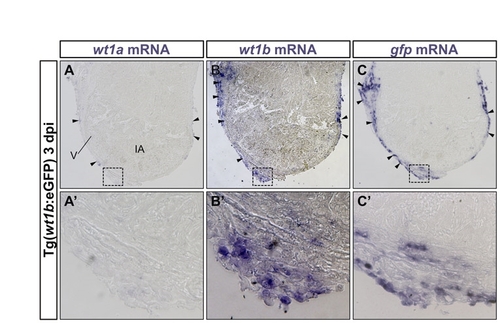
GFP expression in the hearts of Tg(wt1b:GFP) zebrafish mirrors cryoinjury-induced upregulation of wt1b mRNA in the epicardium. In situ hybridization on adjacent sections of cryoinjured zebrafish hearts at 3 dpi. (A-C) Sections were hybridized with wt1a (A), wt1b (B) and gfp (C) riboprobes. (A2-C2) Higher magnification views of boxed areas. Arrowheads indicate stained epicardial cells. wt1a mRNA is expressed in a subset of epicardial cells. wt1b is expressed in a larger population of epicardial cells. gfp expression overlaps with the expression domain of wt1b. IA, injured area; dpi, days postinjury; V, ventricle. |