
- Title
-
The HMGB protein gene family in zebrafish: Evolution and embryonic expression patterns
- Authors
- Moleri, S., Cappellano, G., Gaudenzi, G., Cermenati, S., Cotelli, F., Horner, D.S., and Beltrame, M.
- Source
- Full text @ Gene Expr. Patterns
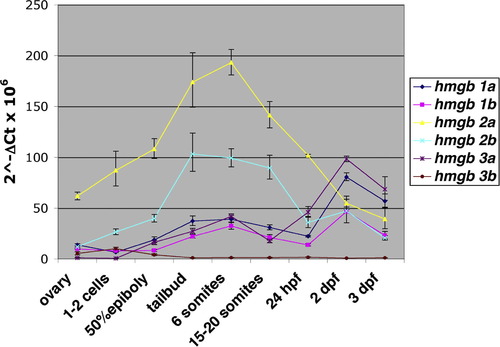
Quantitative expression analysis of hmgb genes. Real-Time RT-PCR was performed using cDNAs retrotranscribed from RNA samples of adult ovary and a series of developmental stages with TaqMan probes specific for zf hmgb genes, to analyze their expression levels during zebrafish development. Averaged data for each gene were normalized to an 18S rRNA endogenous control, thus obtaining ΔCt values; standard deviations are shown. The results are represented as relative expression levels (2ΔCt × 106 on the y axis) versus developmental stages or ovary on the x axis. The ovary RNA sample has been included to analyze maternal RNA content. RNA samples are as follows: ovary, 1-2 cell stage, 50% epiboly, tailbud, 6 somite stage, 15-20 somite stage, 24 hpf, 2 and 3 dpf. All transcripts are maternally expressed, at different levels. hmgb2a/2b are the most highly expressed hmgb genes until 1 dpf; their mRNA levels peak during somitogenesis. hmgb1a/1b display a moderate peak during somitogenesis but their expression reaches the highest level at 2 dpf, when hmgb1b level becomes comparable to hmgb2a/2b while hmgb1a even exceeds them. hmgb3b is the lowest expressed gene at every examined stage, while hmgb3a expression increases during development and it is the most highly expressed hmgb gene at 2-3 dpf. |

hmgb genes are broadly expressed at early developmental stages in largely overlapping patterns. Some representative ISH pictures (40× magnification) are shown to summarize the expression of zebrafish hmgb genes. Embryos subject to short staining were chosen when expression details could not be clearly visualized upon prolonged staining (panels F, G and I); staining levels are therefore not directly comparable, unless specified. (A–D) At the earliest developmental stages, all hmgb genes are ubiquitously expressed although their expression levels are different: the hmgb2a/2b signals are much higher (B and D) while all the other genes are less expressed (exemplified in A and C) epi, epiboly. (E and F) At tailbud stage, only hmgb2a transcripts are under-represented at the midline (compare white arrowheads in F and E). (G and H) At 6–8 somites all hmgb genes are ubiquitously expressed in the whole embryo, excluding the notochord (G); only hmgb1a probe preferentially mark somites subdomains (H, white arrow). (I and L) During late somitogenesis, hmgb genes are ubiquitously expressed, with the exception of notochord and somites (grey arrows), but hmgb3a is not expressed in the eyes (compare white asterisk in inset L with the one in I). |

hmgb genes are expressed in more restricted and gene-specific patterns during late embryogenesis. A selection of representative WISHs (A, D, F, G, M and N: 40× magnification) and transverse sections (B, C and E: 200× magnification, H–L, O–Q: 130× magnification) are shown. (A–E) 24 hpf: hmgb1a/1b and hmgb3a are mainly expressed in the rostral CNS (A–C) but also visible in the spinal cord (SC), in the lateral line primordium and in the intermediate cell mass (A, blue arrow and arrowhead, respectively). Only hmgb3a is under-represented in eyes (C). hmgb2a/2b are more highly and broadly expressed (D and E), with the notable exception of the somitic mesoderm (E, grey arrow). A moderately stained embryo is shown in panel D. (F–Q) 2 dpf: hmgb3b staining is almost undetectable, while all other hmgb signals are highly visible in the rostral part of the embryo, including the rostral CNS (F–H, M–O). hmgb1a and hmgb2a/2b probes strongly mark lateral line neuromasts (arrowheads in F, G and L) and endodermal derivates including gut and liver (arrows in F, G, I and L) while hmgb1b transcripts are detectable in the pronephric ducts (light blue arrow in M). hmgb3a remains faintly expressed in the eyes (N and O) and does not show staining in the gut nor in the lateral line neuromasts (P and Q). SC, spinal cord; Di, diencephalon; E, eye; R, retina; Le, lens. |

Spatial expression of zebrafish hmgb1a. (A–C) At early developmental stages zebrafish hmgb1a is ubiquitously expressed. (D and E) At 6–8 somites it is preferentially expressed in somites subdomains (D, white arrow) and at 20–22 somites it is still broadly expressed, with the exception of the notochord and somites (E, grey arrow). (F and G) At 24 hpf, hmgb1a expression is restricted to specific regions of the embryos, mainly in the CNS, but is also visible in the spinal cord (SC), in the lateral line primordium (F, blue arrow), in the intermediate cell mass (F, blue arrowhead) and in pectoral fin buds (G, asterisk). (H and I) At 2 dpf the detectable signal is in the rostral CNS, in lateral line neuromasts (H, arrowheads), in the gut (H, arrow) and in pectoral fin buds (I, asterisk). Panel D shows a flat-mount embryo; all other panels show whole-mount images. (A, C, D, G and I) Dorsal views; (B, E, F and H) lateral views, anterior to the left. All images are taken at 40× magnification. Pictures showing shortly stained embryos were chosen when expression details could not be clearly visualized upon prolonged staining (panels F and G). No significant signal was obtained in ISHs performed with a sense probe (data not shown). |

Spatial expression of zebrafish hmgb1b. (A–C) At early developmental stages hmgb1b is ubiquitously expressed, and at tailbud stage it is particularly expressed at the midline (C, white arrowhead). (D and E) During somitogenesis it is still broadly expressed, with the exception of the notochord and somites (E, grey arrow). (F and G) At 24 hpf, hmgb1b expression is restricted to specific regions of the embryos, mainly in the CNS, but is also visible in the spinal cord (SC), in the lateral line primordium (F, blue arrow), in the intermediate cell mass (F, blue arrowhead) and in pectoral fin buds (G, asterisk). (H and I) At 2 dpf the detectable signal is in the rostral CNS, in the pronephric ducts (H, light blue arrow) and in pectoral fin buds (I, asterisk). All panels show whole-mount images. (A, C, D, G and I) Dorsal views; (B, E, F and H) lateral views, anterior to the left. All images are taken at 40× magnification. |

Spatial expression of zebrafish hmgb2a. (A–C) At early developmental stages hmgb2a is highly and ubiquitously expressed, but at tailbud stage hmgb2a transcripts are under-represented at the midline (C, white arrowhead). (D–G) During somitogenesis it is still broadly expressed with the exception of notochord and somites (F, grey arrow); the white asterisk in (G) marks the eye. (H and I) At 24 hpf, hmgb2a is highly and broadly expressed, with the notable exception of the somitic mesoderm and notochord. (L and M) At 2 dpf the hmgb2a signal is detectable in the rostral CNS, in pectoral fin buds, in lateral line neuromasts (L, arrowheads) and in the gut (L, arrow). All panels show whole-mount images. (A, C, E, G, I and M) Dorsal views; (B, D, F, H and L) lateral views, anterior to the left. All images are taken at 40× magnification. Pictures showing shortly stained embryos were chosen when expression details could not be clearly visualized upon prolonged staining (panels C, F–I). No significant signal was obtained in ISHs performed with a sense probe (data not shown). |
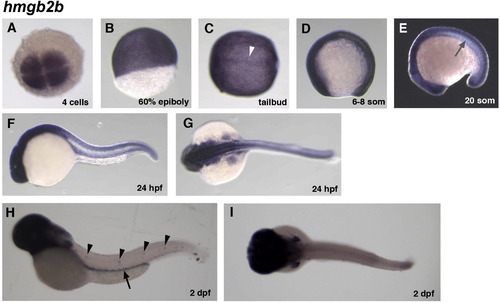
Spatial expression of zebrafish hmgb2b. (A–C) At early developmental stages hmgb2b is highly and ubiquitously expressed, and at tailbud stage it is particularly expressed at the midline (C, white arrowhead). (D–E) Even during somitogenesis it is broadly expressed, with the exception of notochord and somites (E, grey arrow). (F and G) At 24 hpf, hmgb2b is highly and broadly expressed, with the notable exception of the somitic mesoderm and notochord. (H and I) At 2 dpf the detectable signal is in the rostral CNS, in pectoral fin buds, in lateral line neuromasts (H, arrowheads) and in the gut (H, arrow). All panels show whole-mount images. (A, C, G and I) Dorsal views; (B, D, E, F and H) lateral views, anterior to the left. All images are taken at 40× magnification. Pictures showing shortly stained embryos were chosen when expression details could not be clearly visualized upon prolonged staining (panels E–G). No significant signal was obtained in ISHs performed with a sense probe (data not shown). |
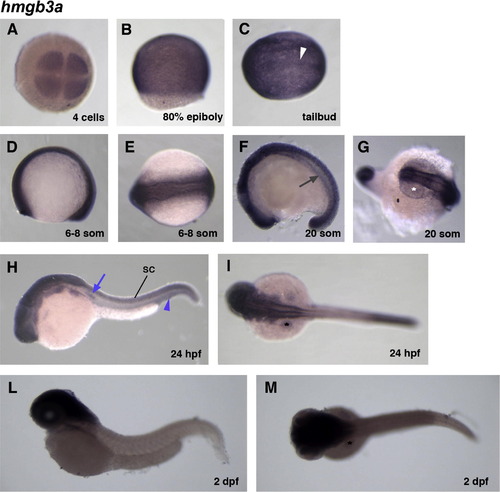
Spatial expression of zebrafish hmgb3a. (A–C) At early developmental stages hmgb3a is ubiquitously expressed, and at tailbud stage it is particularly expressed at the midline (C, white arrowhead). (D–G) Even during somitogenesis it is broadly expressed, with the exception of notochord, somites (F, grey arrow) and eyes (G, white asterisk). (H and I) At 24 hpf, hmgb3a expression is restricted to specific regions of the embryos, mainly in the CNS, but is also visible in the spinal cord (SC), in the lateral line primordium (H, blue arrow), in the intermediate cell mass (H, blue arrowhead) and weakly in pectoral fin buds (I, asterisk). (L–M) At 2 dpf the signal is detectable in the rostral CNS and weakly in pectoral fin buds (M, asterisk). All panels show whole-mount images. (A, C, E, G, I and M) Dorsal views; (B, D, F, H and L) lateral views, anterior to the left. All images are taken at 40× magnification. Prolonged staining was performed at all stages to better visualize the expression pattern. No significant signal was obtained in ISHs performed with a sense probe (data not shown). |
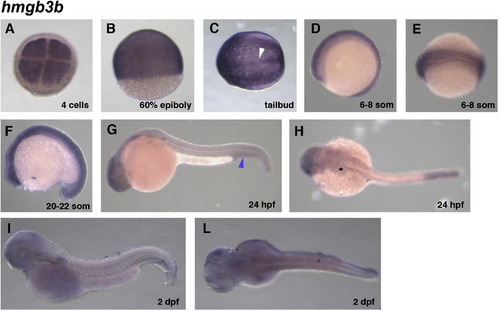
Spatial expression of zebrafish hmgb3b. (A–C) At early developmental stages hmgb3b staining is comparable to hmgb3a staining. (D–F) Starting from somitogenesis, the staining with the hmgb3b probe becomes progressively fainter and at 24 hpf (G–H) some staining is visible in the rostral CNS and pectoral fin buds (H, asterisk), as well as in the intermediate cell mass (G, blue arrowhead). (I–L) At 2 dpf, hmgb3b staining is barely detectable. All panels show whole-mount images. (A, C, E, H and L) Dorsal views; (B, D, F, G and I) lateral views, anterior to the left. All images are taken at 40× magnification. Prolonged staining was performed at all stages to better visualize the expression pattern. |
Reprinted from Gene expression patterns : GEP, 11(1-2), Moleri, S., Cappellano, G., Gaudenzi, G., Cermenati, S., Cotelli, F., Horner, D.S., and Beltrame, M., The HMGB protein gene family in zebrafish: Evolution and embryonic expression patterns, 3-11, Copyright (2011) with permission from Elsevier. Full text @ Gene Expr. Patterns