
Fig. S7
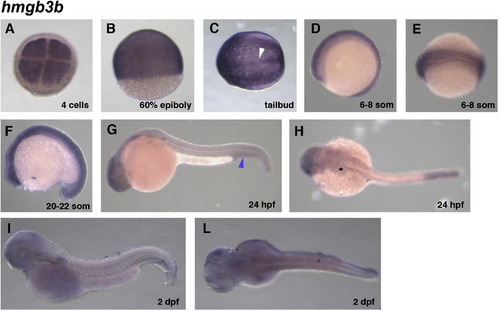
Spatial expression of zebrafish hmgb3b. (A–C) At early developmental stages hmgb3b staining is comparable to hmgb3a staining. (D–F) Starting from somitogenesis, the staining with the hmgb3b probe becomes progressively fainter and at 24 hpf (G–H) some staining is visible in the rostral CNS and pectoral fin buds (H, asterisk), as well as in the intermediate cell mass (G, blue arrowhead). (I–L) At 2 dpf, hmgb3b staining is barely detectable. All panels show whole-mount images. (A, C, E, H and L) Dorsal views; (B, D, F, G and I) lateral views, anterior to the left. All images are taken at 40× magnification. Prolonged staining was performed at all stages to better visualize the expression pattern. |
| Gene: | |
|---|---|
| Fish: | |
| Anatomical Terms: | |
| Stage Range: | 4-cell to Long-pec |
Reprinted from Gene expression patterns : GEP, 11(1-2), Moleri, S., Cappellano, G., Gaudenzi, G., Cermenati, S., Cotelli, F., Horner, D.S., and Beltrame, M., The HMGB protein gene family in zebrafish: Evolution and embryonic expression patterns, 3-11, Copyright (2011) with permission from Elsevier. Full text @ Gene Expr. Patterns