FIGURE SUMMARY
Title

Molecular asymmetry in the cephalochordate embryo revealed by single-blastomere transcriptome profiling

Authors
Lin, C.Y., Lu, M.J., Yue, J.X., Li, K.L., Le Pétillon, Y., Yong, L.W., Chen, Y.H., Tsai, F.Y., Lyu, Y.F., Chen, C.Y., Hwang, S.L., Su, Y.H., Yu, J.K.
Source
Full text @ PLoS Genet.

RNA-seq analyses of blastomeres from the 2-cell stage and animal/vegetal tiers from the 8-cell stage.

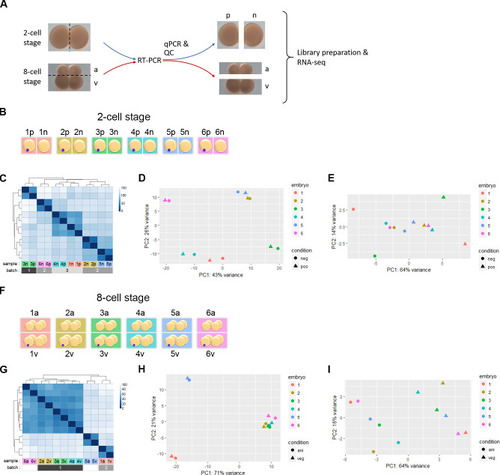
(A) Images of 2-cell and 8-cell amphioxus embryos, with an illustration of the strategy for RNA-seq. Dashed lines indicate the planes separating blastomeres of each paired sample. The presumptive germ granule-positive (p) and germ granule-negative (n), and animal-tier (a) vs. vegetal-tier (v) blastomeres are indicated. (B) A schematic representation of the experiment using single blastomeres from 2-cell stage embryos (six biological replicates). Blue dot denotes the germ granule in the presumptive germ granule-positive blastomere in each embryo (from 1p to 6p) based on qPCR analysis (S1 Fig); the other cell from the same embryo is designated as the germ granule-negative cell (from 1n to 6n). (C) Hierarchically clustered heatmap based on the Euclidean distances between 2-cell stage samples. Identification of the samples and their batch of origin are shown at the bottom of the heatmap. (D) PCA of the twelve 2-cell stage samples shows strong embryo and batch effects. (E) PCA of the twelve 2-cell stage samples after data normalization to account for individual embryo differences. (F) A schematic representation of the experiment on animal (1a-6a) and vegetal tiers (1v-6v) from 8-cell stage embryos (six biological replicates). Blue dots denote the germ granule that is present in one of the blastomeres of the vegetal tier. (G) Hierarchically clustered heatmap based on the Euclidean distances between 8-cell stage samples. Identification of the samples and batch of origin are shown at the bottom of the heatmap. Batch identities of 5a/v and 6a/v were not recorded. (H) PCA of the twelve 8-cell stage samples shows strong embryo and batch effects. (I) PCA of the twelve 8-cell stage samples after data normalization to account for individual embryo differences.

Identification of differentially enriched transcripts (DETs).

(A-B) MA-plots showing the log2 fold changes between the germ granule-positive and negative cells over the average transcript level of each gene among the 2-cell stage samples analyzed by using DESeq2 (A) or edgeR (B). The DETs (FDR < 0.1) are shown in red. (C) Distribution of FPKM values of DETs based on DESeq2 (orange) and edgeR (blue) analyses at the 2-cell stage. (D-E) MA-plots showing the log2 fold changes between the animal and vegetal tiers over the average transcript level of each gene among the 8-cell stage samples analyzed by using DESeq2 (D) or edgeR (E). (F) Distribution of FPKM values of DETs based on DESeq2 (orange) and edgeR (blue) analyses at the 8-cell stage. (G-J) Venn diagrams show the number of DETs in the germ granule-positive cell (G), germ granule-negative cell (H), animal tier (I) and vegetal tier (J), comparing results between DESeq2 and edgeR analyses. Underlying data are available in S1 Data.

Visualization of the transcriptome data showing asymmetric distributions of transcripts in the early amphioxus embryo.

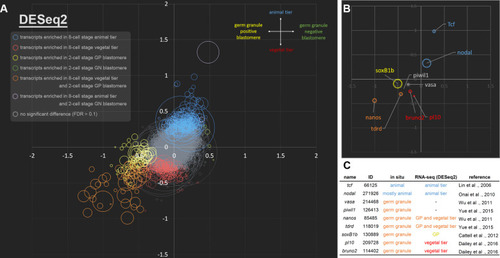
(A) A scatter plot showing the log2 fold change of each gene between animal (positive y-axis) and vegetal tiers (negative y-axis) at the 8-cell stage, and its corresponding log2 fold change between germ granule-negative (positive x-axis) and positive blastomeres (negative x-axis) at the 2-cell stage (based on DESeq2). Size of the circle depicts FPKM values of the corresponding DET. Color of the circle indicates that the transcript is differentially enriched in a specific embryonic domain. Blue circles (total number = 264) are DETs in the animal tier; red circles (178) are DETs in the vegetal tier; yellow circles (58) are DETs in germ granule-positive blastomere; green circles (4) are DETs in germ granule-negative blastomere; orange circles (57) are DETs in both the germ granule-positive blastomere and the vegetal tier; purple circles (2) are DETs in both the germ granule-negative blastomere and the animal tier. Transcripts that are not enriched are in gray. (B) A scatter plot showing the spatial distributions of nine previously characterized transcripts. (C) Summary information for the nine previously characterized genes. GP, germ granule-positive blastomere. ID, gene model ID from genome assembly v2.0.

Validation of newly identified germ granule-enriched transcripts by WMISH.

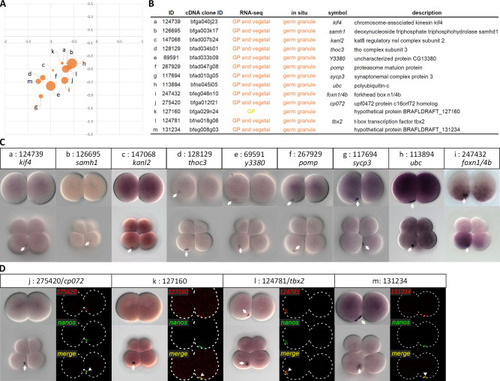
(A) Visualization map of 13 germ granule-enriched transcripts based on DESeq2. (B) Annotations of the validated transcripts. (C) WMISH of the corresponding transcripts at 2- and 8-cell stages. The white arrows indicate aggregated signals on the vegetal side. Animal pole is up and vegetal pole is down. (D) Double fluorescence in situ hybridization showed that four newly identified transcripts were co-localized with nanos transcripts in the germ granule. The white arrowheads indicate co-localized signals. The white arrows indicate the compact germ granule signals. Embryo outlines are demarcated by dashed lines. The WMISH images show representative expression patterns (> 80%, n ≥ 5).

Validation of newly identified animal tier-enriched transcripts by WMISH.

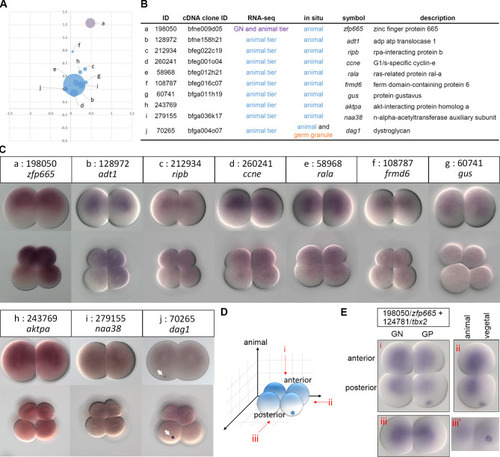
(A) The scatter plot shows spatial distributions of ten animal tier-enriched transcripts based on DESeq2. (B) Annotations of the validated transcripts. (C) WMISH of the corresponding transcripts at the 2- and 8-cell stages. The arrows indicate the aggregated signals on the vegetal side. Animal is up and vegetal is down. (D) A schematic representation showing different views of a 4-cell stage amphioxus embryo, (i) animal pole view, (ii) lateral view, and (iii) posterior view. Transcripts enriched in the germ granule and toward the animal pole are illustrated in blue. (E) Double WMISH of zfp665 (198050) and tbx2 (124781) at the 4-cell stage. Embryos are observed from different views as indicated in (D). A surface focal plane of the posterior view (iii’) showing the germ granule-enriched transcripts. The WMISH images show representative expression patterns (> 80%, n ≥ 5).

Gene ontology (GO) enrichment analyses of the DETs.

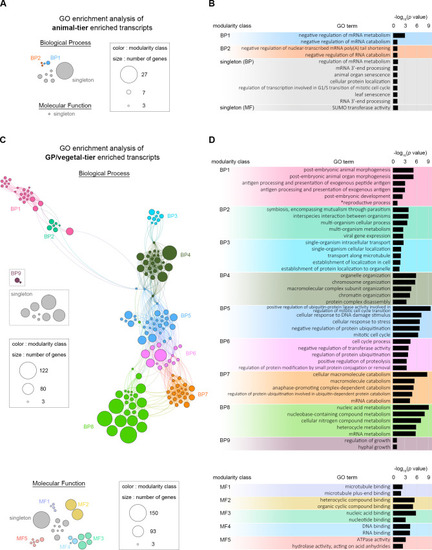
(A) Results of the GO enrichment network analysis (adjusted p value < 0.1) of animal tier-enriched transcripts. Individual node of the network denotes a specific enriched GO term, including biological process (BP) and molecular function (MF). The GO terms are clustered and divided into different modules that are labeled with different colors. Unclassified GO terms are labeled as singletons. Sizes of the circles indicate numbers of genes in each GO term. (B) Descriptions of the most enriched GO terms within each module for the animal tier-enriched transcripts. The bars indicate -log10 adjusted p values for the corresponding GO terms. (C) Results of the GO enrichment network analysis (adjusted p value < 0.1) of germ granule-positive and/or vegetal tier-enriched transcripts. Individual node of network denotes a specific enriched GO term, including biological process (upper panel) and molecular function (lower panel). Lines connecting different nodes represent their semantic similarity. (D) Descriptions of GO terms within each module with the -log10 adjusted p value. Five GO terms with the smallest adjusted p values from different modules are presented. One manually selected GO term is indicated (*).

Functional validation of four asymmetrically localized transcripts encoding transcription factors.

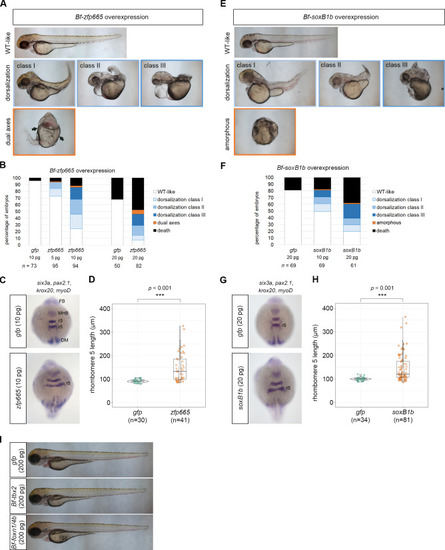
(A) Phenotypes of the 48 hpf zebrafish embryos injected with amphioxus zfp665 mRNA. (B) Percentages of 48 hpf zebrafish embryos with the indicated phenotypes following injection of gfp (control) or amphioxus zfp665 mRNA. (C) WMISH of pax2.1, krox20, myoD and six3a in gfp (control) or amphioxus zfp665 mRNA-injected zebrafish embryos at the 10 somite stage. (D) Statistical analysis of the lengths of rhombomeres 5 in gfp and zfp665 mRNA injected zebrafish embryos at the 10 somite stage. (E) Phenotype of the 48 hpf zebrafish embryos injected with amphioxus soxB1b mRNA. (F) Percentages of 48 hpf zebrafish embryos with the indicated phenotypes after injection of gfp (control) or amphioxus soxB1b mRNA. (G) WMISH of pax2.1, krox20, myoD and six3a in gfp (control) or amphioxus soxB1b mRNA-injected zebrafish embryos at the 10 somite stage. (H) Statistical analysis of the lengths of rhombomeres 5 in gfp and soxB1b mRNA-injected zebrafish embryos at the 10 somite stage. (I) Embryos injected with amphioxus tbx2 or foxn1/4b mRNA did not show any detectable axial defects compared to control embryos at 72 hpf. DM, dorsal mesoderm; FB, forebrain; MHB, midbrain-hindbrain boundary; r3, rhombomere 3; r5, rhombomere 5. Statistical significance was determined by Student’s t-test. ***p < 0.001. Underlying data are available in S1 Data.

Expression domain of the ventral gene, <italic>eve1</italic>, was significantly reduced in <italic xmlns:xlink='http://www.w3.org/1999/xlink'>zfp665</italic> overexpressed zebrafish embryos.

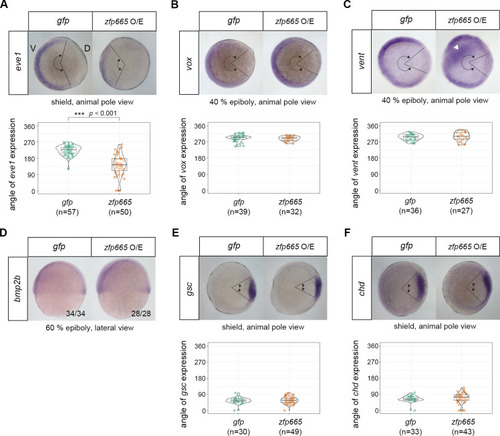
(A-F) WMISH of zebrafish dorsal-ventral genes eve1 (A), vox (B), vent (C), bmp2b (D), gsc (E) and chd (F), in gfp (control) or amphioxus zfp665 mRNA-injected zebrafish embryos. The stages and views of the embryos are indicated below the images. Statistical analyses of eve1, vox, vent, gsc and chd expression domains in embryos injected with gfp and zfp665 mRNA. The expression domains were quantified by measuring the angles of the signals observed from the animal pole. Ectopic expression of vent (arrowhead) was observed in some zfp665-overexpressing embryos (44%, n = 27) (C). The ratio of embryos exhibiting the displayed bmp2b expression patterns is indicated in the bottom right-hand corner (D). V, ventral side; D, dorsal side. Statistical significance was determined by Student’s t-test, ***p < 0.001. Underlying data are available in S1 Data.

Functional validation of <italic>zfp665</italic> as a transcriptional repressor in zebrafish embryos.

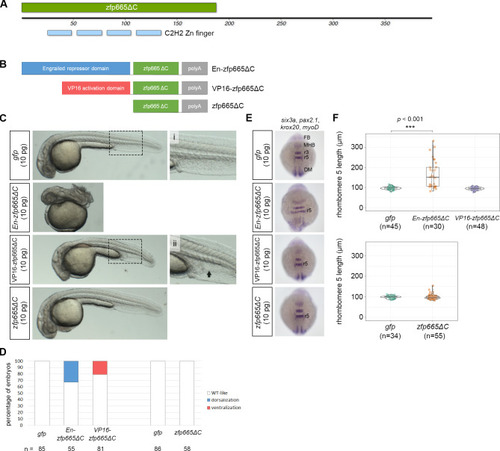
(A) A schematic representation of the protein domain organization of amphioxus zfp665, showing four consecutive C2H2-type zinc finger domains at the N-terminus. zfp665ΔC denotes the zinc finger region of zfp665 without its C-terminus. (B) A schematic representation of three different zfp665 fusion proteins, including engrailed repressor domain-zfp665ΔC fusion protein (En-zfp665ΔC), VP16 activation domain-zfp665ΔC (VP16-zfp665ΔC) fusion protein and the deletion of C-terminus of zfp665 (zfp665ΔC). (C) Phenotype of the zebrafish embryos injected with one of the three in vitro synthesized mRNA encoding the zfp665 fusion proteins at 24 hpf. (i) and (ii) are high-magnification views of the corresponding boxed areas. The black arrow indicates expanded ventral tissue. (D) Percentages of 24 hpf zebrafish embryos with the indicated phenotypes after injection of gfp (control) or one of the three in vitro synthesized amphioxus mRNAs encoding zfp665 fusion proteins. Only live larvae were scored. (E) WMISH of pax2.1, krox20, myoD and six3a in gfp (control) or indicated amphioxus mRNA-injected zebrafish embryos at the 10 somite stage. (F) Statistical analysis of the lengths of rhombomere 5 at the 10 somite stage in zebrafish embryos injected with gfp or one of the three forms of zfp665 mRNAs. DM, dorsal mesoderm; FB, forebrain; MHB, midbrain-hindbrain boundary; r3, rhombomere 3; r5, rhombomere 5. Statistical significance was determined by Welch’s one-way ANOVA with Games-Howell post hoc test plus Bonferroni correction when the number of groups was greater than 2 or Student’s t-test when the number of groups was 2. ***p < 0.001. Underlying data are available in S1 Data.

Acknowledgments
This image is the copyrighted work of the attributed author or publisher, and ZFIN has permission only to display this image to its users. Additional permissions should be obtained from the applicable author or publisher of the image. Full text @ PLoS Genet.