
Fig 3
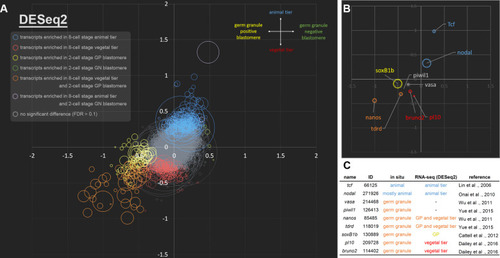
(A) A scatter plot showing the log2 fold change of each gene between animal (positive y-axis) and vegetal tiers (negative y-axis) at the 8-cell stage, and its corresponding log2 fold change between germ granule-negative (positive x-axis) and positive blastomeres (negative x-axis) at the 2-cell stage (based on DESeq2). Size of the circle depicts FPKM values of the corresponding DET. Color of the circle indicates that the transcript is differentially enriched in a specific embryonic domain. Blue circles (total number = 264) are DETs in the animal tier; red circles (178) are DETs in the vegetal tier; yellow circles (58) are DETs in germ granule-positive blastomere; green circles (4) are DETs in germ granule-negative blastomere; orange circles (57) are DETs in both the germ granule-positive blastomere and the vegetal tier; purple circles (2) are DETs in both the germ granule-negative blastomere and the animal tier. Transcripts that are not enriched are in gray. (B) A scatter plot showing the spatial distributions of nine previously characterized transcripts. (C) Summary information for the nine previously characterized genes. GP, germ granule-positive blastomere. ID, gene model ID from genome assembly v2.0. |