
|
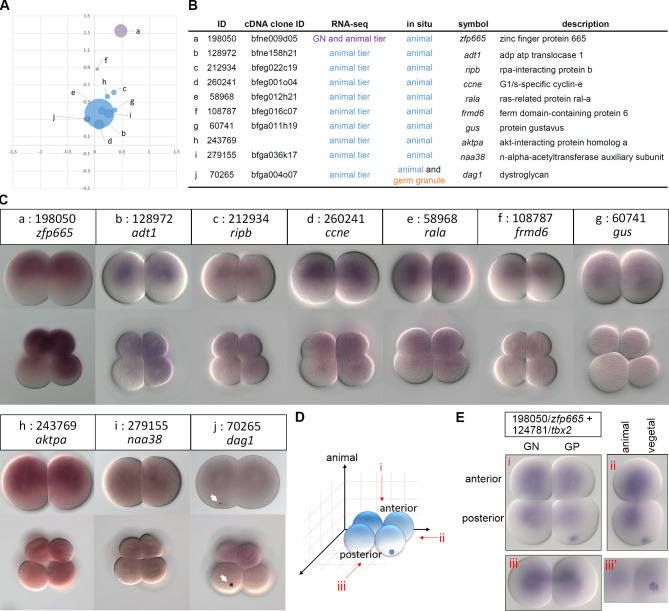
Fig 5
(A) The scatter plot shows spatial distributions of ten animal tier-enriched transcripts based on DESeq2. (B) Annotations of the validated transcripts. (C) WMISH of the corresponding transcripts at the 2- and 8-cell stages. The arrows indicate the aggregated signals on the vegetal side. Animal is up and vegetal is down. (D) A schematic representation showing different views of a 4-cell stage amphioxus embryo, (i) animal pole view, (ii) lateral view, and (iii) posterior view. Transcripts enriched in the germ granule and toward the animal pole are illustrated in blue. (E) Double WMISH of