
Fig 4
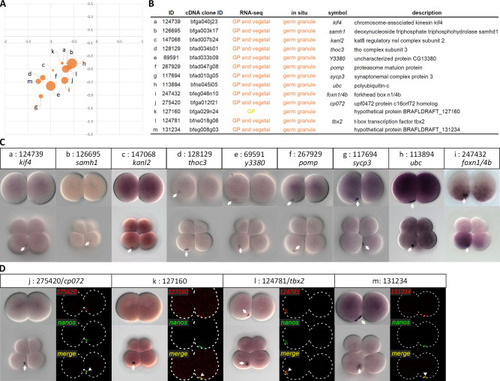
(A) Visualization map of 13 germ granule-enriched transcripts based on DESeq2. (B) Annotations of the validated transcripts. (C) WMISH of the corresponding transcripts at 2- and 8-cell stages. The white arrows indicate aggregated signals on the vegetal side. Animal pole is up and vegetal pole is down. (D) Double fluorescence |