
|
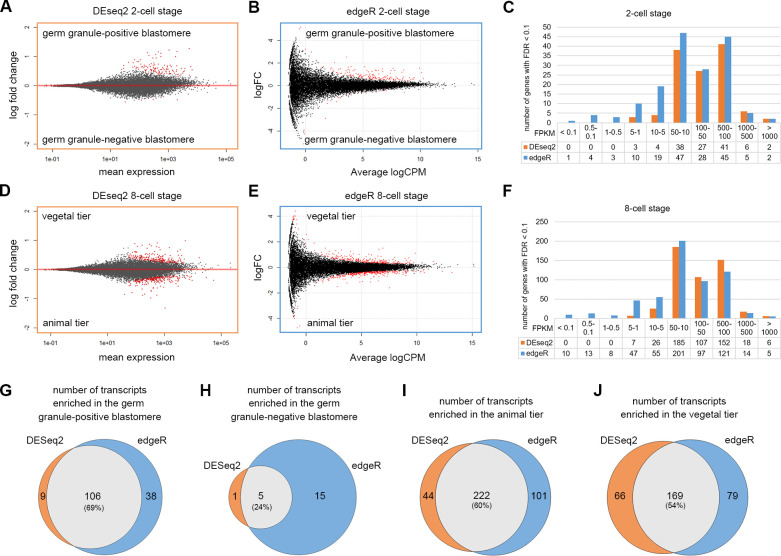
Fig 2
(A-B) MA-plots showing the log2 fold changes between the germ granule-positive and negative cells over the average transcript level of each gene among the 2-cell stage samples analyzed by using DESeq2 (A) or edgeR (B). The DETs (FDR < 0.1) are shown in red. (C) Distribution of FPKM values of DETs based on DESeq2 (orange) and edgeR (blue) analyses at the 2-cell stage. (D-E) MA-plots showing the log2 fold changes between the animal and vegetal tiers over the average transcript level of each gene among the 8-cell stage samples analyzed by using DESeq2 (D) or edgeR (E). (F) Distribution of FPKM values of DETs based on DESeq2 (orange) and edgeR (blue) analyses at the 8-cell stage. (G-J) Venn diagrams show the number of DETs in the germ granule-positive cell (G), germ granule-negative cell (H), animal tier (I) and vegetal tier (J), comparing results between DESeq2 and edgeR analyses. Underlying data are available in