- Title
-
Nppa and Nppb act redundantly during zebrafish cardiac development to confine AVC marker expression and reduce cardiac jelly volume
- Authors
- Grassini, D.R., Lagendijk, A.K., De Angelis, J.E., Da Silva, J., Jeanes, A., Zettler, N., Bower, N.I., Hogan, B.M., Smith, K.A.
- Source
- Full text @ Development
|
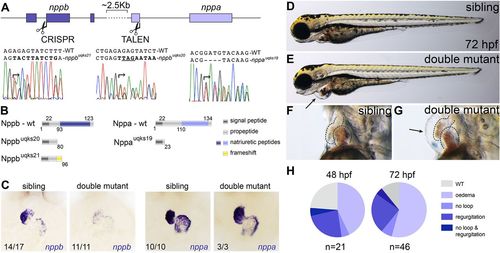
Nppa and Nppb play redundant roles during early cardiac development. (A) Schematic of the zebrafish nppb and nppa gene cluster (on chromosome 8) and respective nppb CRISPR/Cas9 (base pair 239) and nppa TALEN cleavage sites (base pair 54). Sanger sequencing show three alleles of nppa and nppb genes identified following genome editing (nppauq19ks, nppbuq20ks and nppbuq21ks). (B) Schematics of Nppa and Nppb wild-type and mutant proteins. Numbers indicate predicted amino acid positions. (C) In situ hybridisation for nppa and nppb on sibling and double mutant embryos at 48 hpf demonstrate overtly wild-type morphology of double mutant hearts. nppa gene expression is unaltered in double mutants, whereas nppb appears decreased in double mutants. (D-G) Lateral bright-field images of representative 72 h post-fertilisation (hpf) sibling and double mutant embryos. Black arrow indicates the pericardial oedema observed in double mutants. (H) Pie charts illustrate the penetrance and expressivity of the phenotype at 48 hpf and 72 hpf. EXPRESSION / LABELING:
PHENOTYPE:
|
|
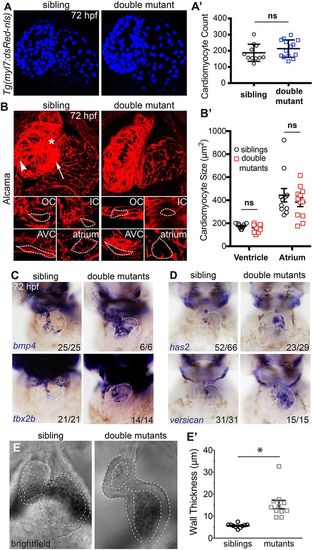
AVC markers are expanded in double mutant embryos and cardiac jelly is thicker. (A) Confocal z-stacks of Tg(myl7:dsRed-nls) embryos (labelling cardiomyocyte nuclei) show no difference in cell number between sibling and double mutant embryos. (A′) Graphical representation of cell number (n=11 siblings; n=14 mutants). (B) Confocal images of representative sibling and double mutant embryos immunostained for Alcama to visualise cell shape. IC, inner curvature (white asterisk); OC, outer curvature (white arrowhead); AVC, atrioventricular canal (white arrow). Individual cardiomyocytes are outlined with broken lines. (B′) Graph showing average cardiomyocyte size of ventricle and atrium in siblings and double mutants (n=11 siblings; n=12 mutants). (C) In situ hybridisation analysis of AVC markers bmp4, tbx2b, has2 and versican are expanded into the atrial chamber of double mutants compared with siblings. (E) Bright-field still images from high-speed movies of hearts at atrial diastole show thickened space (outlined) between the myocardial outer surface and the lumen surface of the heart, indicating thicker cardiac jelly in double mutants. (E′) Quantification of cardiac jelly thickness showing a significant increase in double mutant embryos compared with wild-type siblings when measuring the outer atrial myocardial wall and the inner luminal lining (n=10 siblings; n=11 mutants). ns, not significant; *P<0.05, as determined by t-test. Data are mean±s.d. EXPRESSION / LABELING:
PHENOTYPE:
|
|
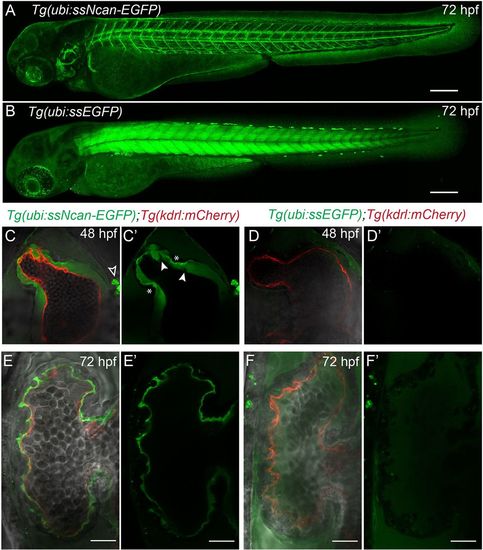
A transgenic biosensor for the cardiac jelly. (A) Lateral view of the Tg(ubi:ssNcan-EGFP) line: a biosensor for hyaluronic acid – a major constituent of the cardiac jelly. The sensor expresses a secreted fusion protein of the HA-binding domain of Neurocan fused to GFP, driven by the ubi promoter. The biosensor localises to regions of HA, including the cardiac jelly, the otic vesicle and around the vasculature. (B) The Tg(ubi:ssEGFP) control was also generated and shows different EGFP localisation, predominantly to the skeletal muscle. Scale bars: 100 µm. (C,C′) Frontal view images of 48 hpf Tg(ubi:ssNcan-EGFP)/Tg(kdrl:mCherry) hearts anaesthetised and live imaged showing the cardiac jelly (green) and endocardial layer (red). ssNcan-EGFP localises to mucous cells (black arrowhead) and is concentrated at the AVC (asterisks). Regions devoid of ssNcan-EGFP in the cardiac jelly due to protruding endocardial cells can also be observed (white arrowheads). (D,D′) Live images of 48 hpf Tg(ubi:ssEGFP)/Tg(kdrl:mCherry) hearts showing near undetectable amounts of ssEGFP localisation (for full z-stacks of C,D, see Movie 2). (E,E′) Live images of 72 hpf Tg(ubi:ssNcan-EGFP)/Tg(kdrl:mCherry) ventricles showing condensed jelly and sites of trabeculae formation. (F,F′) Live images of 72 hpf Tg(ubi:ssEGFP)/Tg(kdrl:mCherry) hearts showing ssEGFP localisation in the pericardial space. Scale bar: 20 µm. EXPRESSION / LABELING:
|
|
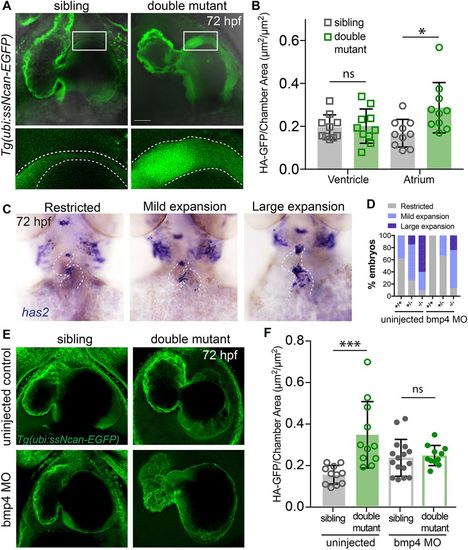
The amount of cardiac jelly is increased in double mutant embryos and the AVC expansion is downstream of Bmp4 signalling. (A) Representative confocal stacks of the cardiac jelly in siblings versus double mutant embryos (ventral view, head towards the top), demonstrating thicker cardiac jelly (outlined) in double mutant embryos at 72 hpf. (B) Dot plot depicting the measurement of cardiac jelly area, showing no significant difference (ns) in jelly thickness of ventricles of siblings versus mutants, whereas significantly more jelly in the atrium of double mutants compared with siblings is observed (n=10; *P<0.05; two-tailed t-test). Data are mean±s.d. (C) Representative images of embryos following in situ hybridisation for has2 expression in sibling and double mutant embryos. Images show categories of has2 expression in embryos at 72 hpf. The heart is outlined. (D) The proportion of embryos with different categories of has2 expression in wild-type (n=13), double heterozygotes (n=34) and double mutant (n=10) embryos in uninjected controls or in wild-type (n=5), double heterozygotes (n=9) and double mutant (n=8) embryos following bmp4 knockdown. The proportion of phenotypes in double mutant embryos injected with bmp4 morpholino most closely resembles uninjected double heterozygotes, demonstrating restoration of has2 expression upon bmp4 knockdown. (E) Representative confocal stacks of Tg(ubi:ssNcan-EGFP) to visualise the cardiac jelly in siblings versus double mutant embryos at 72 hpf, either uninjected or injected with bmp4 morpholino. (F) Dot plots depicting the measurement of cardiac jelly area in atria of sibling versus double mutant embryos. A significant increase in the jelly area is observed between uninjected siblings and double mutants (n=11; ***P<0.01; two-way ANOVA for multiple comparisons with Tukey's post hoc correction). No significant difference (ns) is observed in the jelly area between siblings and double mutants following bmp4 morpholino injection (n=16 siblings; n=11 double mutants), demonstrating that the increase in the cardiac jelly thickness is restored following bmp4 morpholino injection. Two-tailed t-test; data are mean±s.d. Scale bar: 30 μm. EXPRESSION / LABELING:
PHENOTYPE:
|
|
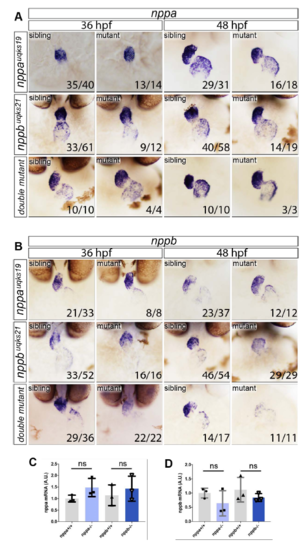
ISH expression analysis of nppa and nppb in siblings, single nppa and nppb mutants and double mutants. Expanded expression analysis from that represented in Figure 1C, showing A. nppa and B. nppb expression at 36 and 48 hpf. No gross differences in either morphology or expression levels are observed for any of the scenarios, with the exception that nppb expression in nppb mutants (or double mutants) has reduced staining by ISH. C. Q-PCR analysis of nppa expression levels in nppa single mutants compared with in-clutch sibling controls or nppb single mutants compared with siblings. No significant difference in expression is observed (ns). D. Q-PCR analysis of nppb expression on nppa and nppb single mutants compared with sibling controls showing no significant difference (ns) between groups. Twotailed t-test on n=3 replicates, where each replicate contained pooled mRNA from 4 genotyped embryos. |
|
Cardiac function is unchanged in nppa/nppb double mutants at 72 hpf. Still images from high-speed movies show phases of atrial diastole (0s), ventricular diastole/atrial systole (0.1s) and ventricular systole (0.4s). B. Dot plots depicting the analysis of heart function between siblings and double mutants. Ventricular stroke volume (SV), atrial stroke volume, ventricular ejection fraction (EF) and atrial ejection fraction showed no significant difference between siblings (n = 10) and double mutant embryos (n = 10). ns = not significant, two-tailed t-test, error bars indicate mean+/- s.e.m. Scale bar = 50um. V = ventricle; A = atrium. |
|
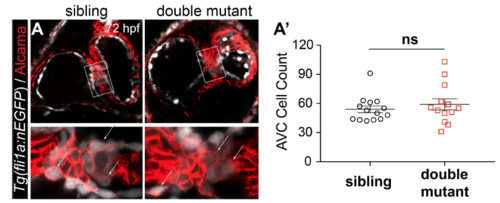
No increase in endocardial cell number is observed in nppa/nppb double mutants compared with siblings. A. Confocal stacks of 72 hpf sibling and double mutant with endocardial nuclei labelled by Tg(fli1a:nEGFP) (white) and myocardial membranes labelled using an anti-Alcama antibody (red). In addition to myocardium, endocardial cushions are also labeled with Alcama, distinguishing them from the remaining endocardium. Double positive cells (white arrows) are quantified in A’. A’. Dot plots representing the number of AVC cells in sibling (n = 14) versus double mutants (n = 13), showing no significant difference (ns; twotailed t-test; error bars indicate the standard error mean). |
|
A chemical inhibitor of Bmp signalling restores the area of the atrial cardiac jelly back to levels of siblings. A. Confocal stacks showing the hearts of sibling and double mutant embryos at 72 hpf in the Tg(ubi:ssNcan-EGFP) background treated with either DMSO control or the Bmp signalling-specific inhibitor, DMH1. Embryos were incubated for 24 hours prior to live imaging and the area of the cardiac jelly quantified for each treatment. B. Dot plots of cardiac jelly area for individual embryos following treatment with either DMSO or DMH1. Double mutant embryos had significantly increased cardiac jelly area compared with sibling controls; however this increase was restored to the levels of siblings, following Bmp inhibition with DMH1. DMSO siblings n=14, DMSO double mutants n=13, DMH1 siblings n=12, DMH1 double mutants n=11. Statistics was determined using a two-way ANOVA for multiple comparisons with Tukey’s post hoc correction. *p < 0.05. ns=not significant. Error bars depict std dev. |

