
Fig. 4 - Supplemental 1
- ID
- ZDB-FIG-250722-71
- Publication
- Wang et al., 2025 - The geometry and dimensionality of brain-wide activity
- Other Figures
-
- Fig. 1
- Fig. 2
- Fig. 2 - Supplemental 1
- Fig. 2 - Supplemental 2
- Fig. 2 - Supplemental 3
- Fig. 2 - Supplemental 4
- Fig. 3
- Fig. 3 - Supplemental 1
- Fig. 3 - Supplemental 2
- Fig. 4
- Fig. 4 - Supplemental 1
- Fig. 4 - Supplemental 2
- Fig. 5
- Fig. 5 - Supplemental 1
- Fig. 5 - Supplemental 2
- Fig. 5 - Supplemental 3
- Fig. 5 - Supplemental 4
- Fig. 5 - Supplemental 5
- Fig. 5 - Supplemental 6
- Fig. 5 - Supplemental 7
- Fig. Appendix Figure 1
- Fig. Appendix Figure 1 (2)
- Fig. Appendix Figure 2
- Fig. Appendix Figure 2 (2)
- Fig. Appendix Figure 3
- Fig. Appendix Figure 3 (2)
- Fig. Appendix Figure 4
- Fig. Appendix Figure 5
- Fig. Appendix Figure 6
- Fig. Appendix Figure 7
- Fig. Appendix Figure 8
- Fig. Appendix Figure 9
- All Figure Page
- Back to All Figure Page
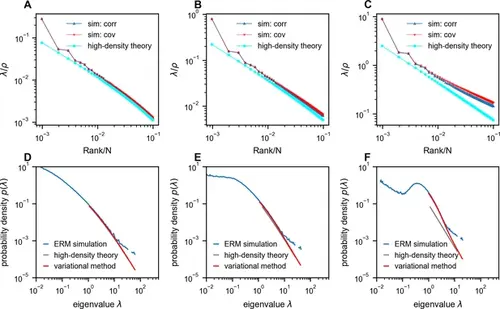
Comparison between Euclidean Random Matrix (ERM) simulation and theory. (A–C) Rank plots of the normalized eigenspectra (λ/ρ ), with the simulations obtained using correlation matrix (sim: corr, σ2i=1 ) and covariance matrix (sim: cov, neuron’s activity variance σ2i is i.i.d. sampled from a log-normal distribution with zero mean and a standard deviation of 0.5 in the natural logarithm of the σ2i values; we also normalize E(σ2i)=1 (Methods)). The curves between ‘sim: corr’ and ‘sim: cov’ are nearly identical in panels (A) and (B). The theoretical predictions of normalized eigenvalues λ/ρ are obtained using the high-density theory (cyan, Equation 12). The density ρ decreases from panel (A) to panel (C) (ρ=1024,256,10.24 , respectively). (D–F) Numerical validation of the theoretical spectrum by comparing probability density functions for increasing density of covariance ERM (ρ=1024,256,10.24 , respectively). Other simulation parameters: N=1024 , d=2 , L=(N/ρ)1/d , μ=0.5 , ϵ=0.03125 . The ERM simulations were conducted 100 times. The results are presented as the mean ± SEM. |