
FIGURE
Fig. 5 - Supplemental 3
- ID
- ZDB-FIG-250722-76
- Publication
- Wang et al., 2025 - The geometry and dimensionality of brain-wide activity
- Other Figures
-
- Fig. 1
- Fig. 2
- Fig. 2 - Supplemental 1
- Fig. 2 - Supplemental 2
- Fig. 2 - Supplemental 3
- Fig. 2 - Supplemental 4
- Fig. 3
- Fig. 3 - Supplemental 1
- Fig. 3 - Supplemental 2
- Fig. 4
- Fig. 4 - Supplemental 1
- Fig. 4 - Supplemental 2
- Fig. 5
- Fig. 5 - Supplemental 1
- Fig. 5 - Supplemental 2
- Fig. 5 - Supplemental 3
- Fig. 5 - Supplemental 4
- Fig. 5 - Supplemental 5
- Fig. 5 - Supplemental 6
- Fig. 5 - Supplemental 7
- Fig. Appendix Figure 1
- Fig. Appendix Figure 1 (2)
- Fig. Appendix Figure 2
- Fig. Appendix Figure 2 (2)
- Fig. Appendix Figure 3
- Fig. Appendix Figure 3 (2)
- Fig. Appendix Figure 4
- Fig. Appendix Figure 5
- Fig. Appendix Figure 6
- Fig. Appendix Figure 7
- Fig. Appendix Figure 8
- Fig. Appendix Figure 9
- All Figure Page
- Back to All Figure Page
Fig. 5 - Supplemental 3
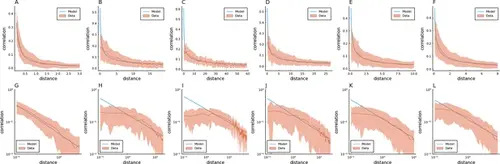
Fitting Euclidean Random Matrix (ERM) to all six zebrafish data from our experiments (part 3). Columns correspond to five light-field zebrafish data: fish 1 to fish 6. (A–F) Comparison of the power-law kernel function f(x⃗ ) in the model (blue line) and the correlation–distance relationship in the data (red line). The distance is calculated from the inferred coordinates using MDS. The shaded area represents the SD. (G–L) Same as (A–D) but on the log–log scale. |
Expression Data
Expression Detail
Antibody Labeling
Phenotype Data
Phenotype Detail
Acknowledgments
This image is the copyrighted work of the attributed author or publisher, and
ZFIN has permission only to display this image to its users.
Additional permissions should be obtained from the applicable author or publisher of the image.
Full text @ Elife