
Fig. 4
- ID
- ZDB-FIG-250722-70
- Publication
- Wang et al., 2025 - The geometry and dimensionality of brain-wide activity
- Other Figures
-
- Fig. 1
- Fig. 2
- Fig. 2 - Supplemental 1
- Fig. 2 - Supplemental 2
- Fig. 2 - Supplemental 3
- Fig. 2 - Supplemental 4
- Fig. 3
- Fig. 3 - Supplemental 1
- Fig. 3 - Supplemental 2
- Fig. 4
- Fig. 4 - Supplemental 1
- Fig. 4 - Supplemental 2
- Fig. 5
- Fig. 5 - Supplemental 1
- Fig. 5 - Supplemental 2
- Fig. 5 - Supplemental 3
- Fig. 5 - Supplemental 4
- Fig. 5 - Supplemental 5
- Fig. 5 - Supplemental 6
- Fig. 5 - Supplemental 7
- Fig. Appendix Figure 1
- Fig. Appendix Figure 1 (2)
- Fig. Appendix Figure 2
- Fig. Appendix Figure 2 (2)
- Fig. Appendix Figure 3
- Fig. Appendix Figure 3 (2)
- Fig. Appendix Figure 4
- Fig. Appendix Figure 5
- Fig. Appendix Figure 6
- Fig. Appendix Figure 7
- Fig. Appendix Figure 8
- Fig. Appendix Figure 9
- All Figure Page
- Back to All Figure Page
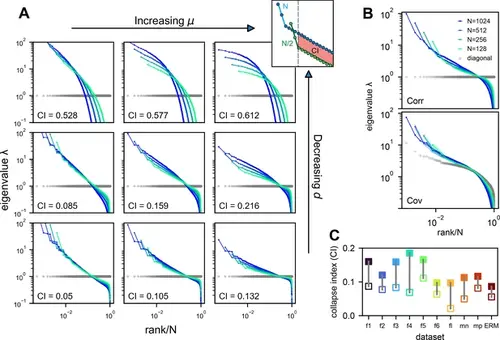
Three factors contributing to scale invariance. (A) Impact of μ and d (see text) on the scale invariance of Euclidean Random Matrix (ERM) spectrum (same plots as Figure 3C) with f(x⃗ )=ϵμ(ϵ2+∥x⃗ ∥2)−μ/2 . The degree of scale invariance is quantified by the collapse index (CI), which essentially measures the area between different spectrum curves (upper right inset). For comparison, we fix the same coordinate range across panels hence some plots are cropped. The gray dots represent the sorted variances Cii of all neurons (same as in Figure 2F). (B) Top: sampled correlation matrix spectrum in an example animal (fish 1). Bottom: same as top but for the covariance matrix that incorporates heterogeneous variances. The gray dots represent the sorted variances Cii of all neurons (same as in Figure 2F). (C) The CI of the correlation matrix (filled squares) is found to be larger than that for the covariance matrix (opened squares) across different datasets: f1 to f6: six light-field zebrafish data (10 Hz per volume, this paper); fl: light-sheet zebrafish data (2 Hz per volume, Chen et al., 2018); mn: mouse Neuropixels data (downsampled to 10 Hz per volume); mp: mouse two-photon data (3 Hz per volume, Stringer et al., 2019b). |