
Fig. 3 - Supplemental 1
- ID
- ZDB-FIG-250722-68
- Publication
- Wang et al., 2025 - The geometry and dimensionality of brain-wide activity
- Other Figures
-
- Fig. 1
- Fig. 2
- Fig. 2 - Supplemental 1
- Fig. 2 - Supplemental 2
- Fig. 2 - Supplemental 3
- Fig. 2 - Supplemental 4
- Fig. 3
- Fig. 3 - Supplemental 1
- Fig. 3 - Supplemental 2
- Fig. 4
- Fig. 4 - Supplemental 1
- Fig. 4 - Supplemental 2
- Fig. 5
- Fig. 5 - Supplemental 1
- Fig. 5 - Supplemental 2
- Fig. 5 - Supplemental 3
- Fig. 5 - Supplemental 4
- Fig. 5 - Supplemental 5
- Fig. 5 - Supplemental 6
- Fig. 5 - Supplemental 7
- Fig. Appendix Figure 1
- Fig. Appendix Figure 1 (2)
- Fig. Appendix Figure 2
- Fig. Appendix Figure 2 (2)
- Fig. Appendix Figure 3
- Fig. Appendix Figure 3 (2)
- Fig. Appendix Figure 4
- Fig. Appendix Figure 5
- Fig. Appendix Figure 6
- Fig. Appendix Figure 7
- Fig. Appendix Figure 8
- Fig. Appendix Figure 9
- All Figure Page
- Back to All Figure Page
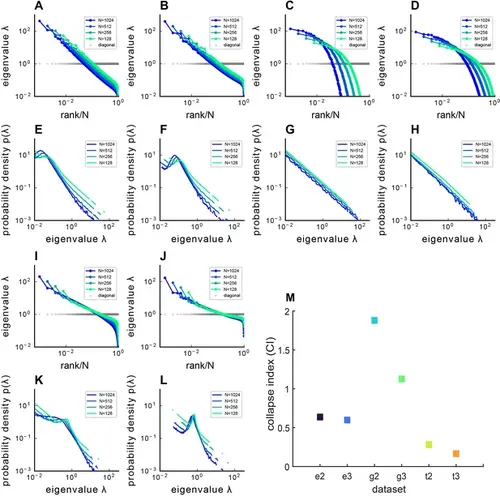
Covariance spectra under different kernel functions f(x⃗ ) . The figure presents both the sampled eigenvalue rank plot and the pdf of Euclidean Random Matrix (ERM) with different functions f(x⃗ ) and varying dimensions d , where panels (A–D, I, J) display the rank plot and panels (E–H, K, L) show the pdf of ERM. (A, E) Exponential function f(x⃗ )=e−∥x∥b where b=1 and dimension d=2 . (B, F) Exponential function f(x⃗ )=e−∥x∥b where b=1 and dimension d=3 . (C, G) Gaussian pdf f(x⃗ )=e−∥x∥22σ2x where σ2x=0.1 and dimension d=2 . (D, H) Gaussian pdf f(x⃗ )=e−∥x∥22σ2x where σ2x=0.1 and dimension d=3 . (I, K) t pdf (Equation 11) and dimension d=2 . (J, L) t pdf (Equation 11) and dimension d=3 . The ERM simulations were conducted 100 times and each ERM used an identical sampling technique described in (Methods). The results represent mean ± SEM. (M) Summary of CIs for different f(x⃗ ) and d . On the x-axis labels, ‘e’ denotes the Exponential function f(x⃗ ) , ‘g’ denotes the Gaussian pdf f(x⃗ ) , ‘t’ denotes the t-distribution pdf f(x⃗ ) , while ‘2’ and ‘3’ indicate d=2 or d=3 , respectively. |