
Fig. 3
- ID
- ZDB-FIG-250722-67
- Publication
- Wang et al., 2025 - The geometry and dimensionality of brain-wide activity
- Other Figures
-
- Fig. 1
- Fig. 2
- Fig. 2 - Supplemental 1
- Fig. 2 - Supplemental 2
- Fig. 2 - Supplemental 3
- Fig. 2 - Supplemental 4
- Fig. 3
- Fig. 3 - Supplemental 1
- Fig. 3 - Supplemental 2
- Fig. 4
- Fig. 4 - Supplemental 1
- Fig. 4 - Supplemental 2
- Fig. 5
- Fig. 5 - Supplemental 1
- Fig. 5 - Supplemental 2
- Fig. 5 - Supplemental 3
- Fig. 5 - Supplemental 4
- Fig. 5 - Supplemental 5
- Fig. 5 - Supplemental 6
- Fig. 5 - Supplemental 7
- Fig. Appendix Figure 1
- Fig. Appendix Figure 1 (2)
- Fig. Appendix Figure 2
- Fig. Appendix Figure 2 (2)
- Fig. Appendix Figure 3
- Fig. Appendix Figure 3 (2)
- Fig. Appendix Figure 4
- Fig. Appendix Figure 5
- Fig. Appendix Figure 6
- Fig. Appendix Figure 7
- Fig. Appendix Figure 8
- Fig. Appendix Figure 9
- All Figure Page
- Back to All Figure Page
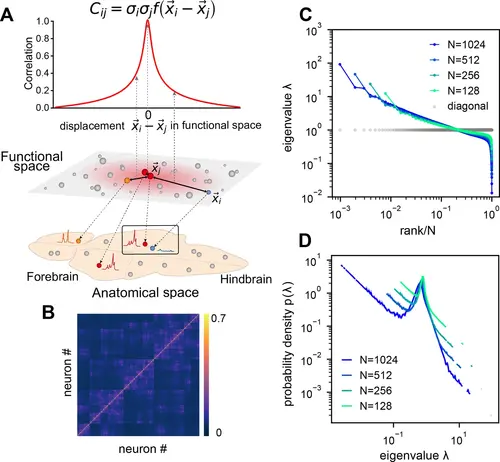
Euclidean Random Matrix (ERM) model of covariance and its eigenspectrum. (A) Schematic of the ERM model, which reorganizes neurons (circles) from the anatomical space to the functional space (here d=2 is a two-dimensional box). The correlation between a pair of neurons decreases with their distance in the functional space according to a kernel function f(x⃗ ) . This correlation is then scaled by neurons’ variance σ2i (circle size) to obtain the covariance Cij . (B) An example ERM correlation matrix (i.e., when σ2i≡1 ). (C) Spectrum (same as Figure 2F) for the ERM correlation matrix in (B). The gray dots represent the sorted variances Cii of all neurons (same as in Figure 2F). (D) Visualizing the distribution of the same ERM eigenvalues in C by plotting the probability density function (pdf). |