
Fig. Appendix Figure 8
- ID
- ZDB-FIG-250722-88
- Publication
- Wang et al., 2025 - The geometry and dimensionality of brain-wide activity
- Other Figures
-
- Fig. 1
- Fig. 2
- Fig. 2 - Supplemental 1
- Fig. 2 - Supplemental 2
- Fig. 2 - Supplemental 3
- Fig. 2 - Supplemental 4
- Fig. 3
- Fig. 3 - Supplemental 1
- Fig. 3 - Supplemental 2
- Fig. 4
- Fig. 4 - Supplemental 1
- Fig. 4 - Supplemental 2
- Fig. 5
- Fig. 5 - Supplemental 1
- Fig. 5 - Supplemental 2
- Fig. 5 - Supplemental 3
- Fig. 5 - Supplemental 4
- Fig. 5 - Supplemental 5
- Fig. 5 - Supplemental 6
- Fig. 5 - Supplemental 7
- Fig. Appendix Figure 1
- Fig. Appendix Figure 1 (2)
- Fig. Appendix Figure 2
- Fig. Appendix Figure 2 (2)
- Fig. Appendix Figure 3
- Fig. Appendix Figure 3 (2)
- Fig. Appendix Figure 4
- Fig. Appendix Figure 5
- Fig. Appendix Figure 6
- Fig. Appendix Figure 7
- Fig. Appendix Figure 8
- Fig. Appendix Figure 9
- All Figure Page
- Back to All Figure Page
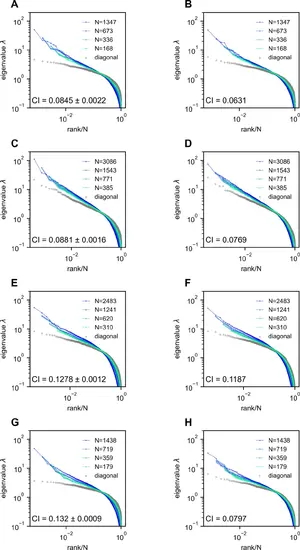
Removing the time segment of hunting behavior does not obliterate the scale-invariant eigenspectra. Rows correspond to four light-field zebrafish data: fish 2 to fish 5 (results for fish 1 have been shown in Appendix 1—figure 7). (A, C, E, G) Ctrl: we randomly remove the same number of time frames that are not the putative hunting frames. We repeat this process 10 times to generate 10 control covariance matrices and the CI is represented by mean ± SD. (B, D, F, H) Hunting removed: data obtained by removing hunting frames from the full data (Appendix 1). The CI for the hunting removed data appears to be significantly smaller than that of the control case (one-sample t-test p=2.2×10⁻¹⁰ in fish 2, p=4.6×10⁻⁹ in fish 3, p=1.7×10⁻⁹ in fish 4, and p=3.4×10⁻¹⁷ in fish 5). |