
FIGURE
Fig. 2 - Supplemental 1
- ID
- ZDB-FIG-250722-63
- Publication
- Wang et al., 2025 - The geometry and dimensionality of brain-wide activity
- Other Figures
-
- Fig. 1
- Fig. 2
- Fig. 2 - Supplemental 1
- Fig. 2 - Supplemental 2
- Fig. 2 - Supplemental 3
- Fig. 2 - Supplemental 4
- Fig. 3
- Fig. 3 - Supplemental 1
- Fig. 3 - Supplemental 2
- Fig. 4
- Fig. 4 - Supplemental 1
- Fig. 4 - Supplemental 2
- Fig. 5
- Fig. 5 - Supplemental 1
- Fig. 5 - Supplemental 2
- Fig. 5 - Supplemental 3
- Fig. 5 - Supplemental 4
- Fig. 5 - Supplemental 5
- Fig. 5 - Supplemental 6
- Fig. 5 - Supplemental 7
- Fig. Appendix Figure 1
- Fig. Appendix Figure 1 (2)
- Fig. Appendix Figure 2
- Fig. Appendix Figure 2 (2)
- Fig. Appendix Figure 3
- Fig. Appendix Figure 3 (2)
- Fig. Appendix Figure 4
- Fig. Appendix Figure 5
- Fig. Appendix Figure 6
- Fig. Appendix Figure 7
- Fig. Appendix Figure 8
- Fig. Appendix Figure 9
- All Figure Page
- Back to All Figure Page
Fig. 2 - Supplemental 1
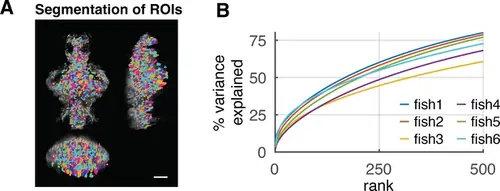
Experimental data description. (A) Spatial distribution of segmented ROIs (shown in different colors). There are 1347–3086 ROIs in each animal. Scale bar, 100 μm. (B) Explained variance of the activity data by PCs up to 500 rank. The different colored lines represent different fish data (n = 6). |
Expression Data
Expression Detail
Antibody Labeling
Phenotype Data
Phenotype Detail
Acknowledgments
This image is the copyrighted work of the attributed author or publisher, and
ZFIN has permission only to display this image to its users.
Additional permissions should be obtained from the applicable author or publisher of the image.
Full text @ Elife