
Fig. Appendix Figure 5
- ID
- ZDB-FIG-250722-85
- Publication
- Wang et al., 2025 - The geometry and dimensionality of brain-wide activity
- Other Figures
-
- Fig. 1
- Fig. 2
- Fig. 2 - Supplemental 1
- Fig. 2 - Supplemental 2
- Fig. 2 - Supplemental 3
- Fig. 2 - Supplemental 4
- Fig. 3
- Fig. 3 - Supplemental 1
- Fig. 3 - Supplemental 2
- Fig. 4
- Fig. 4 - Supplemental 1
- Fig. 4 - Supplemental 2
- Fig. 5
- Fig. 5 - Supplemental 1
- Fig. 5 - Supplemental 2
- Fig. 5 - Supplemental 3
- Fig. 5 - Supplemental 4
- Fig. 5 - Supplemental 5
- Fig. 5 - Supplemental 6
- Fig. 5 - Supplemental 7
- Fig. Appendix Figure 1
- Fig. Appendix Figure 1 (2)
- Fig. Appendix Figure 2
- Fig. Appendix Figure 2 (2)
- Fig. Appendix Figure 3
- Fig. Appendix Figure 3 (2)
- Fig. Appendix Figure 4
- Fig. Appendix Figure 5
- Fig. Appendix Figure 6
- Fig. Appendix Figure 7
- Fig. Appendix Figure 8
- Fig. Appendix Figure 9
- All Figure Page
- Back to All Figure Page
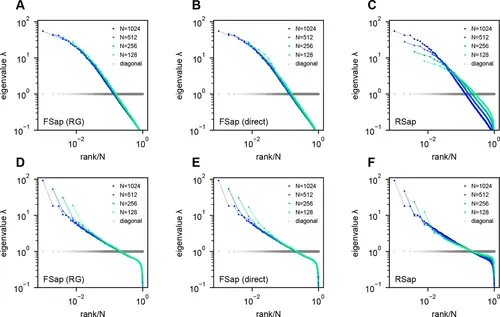
Eigenspectra of renormalization group (RG)-inspired clustering, direct functional region sampling (FSap), and random sampling (RSap) in ERM. (A, D) RG clustered eigenspectra of ERM. The size of the cluster is denoted by N , which is the number of neurons in each cluster. We adopt the RG approach (Meshulam et al., 2018; Meshulam et al., 2019), but with a specific modification (Appendix 1). (B, E) Direct spatial sampling in the functional space (FSap) and the corresponding ERM eigenspectra. We began our analysis with a set of N0 neurons distributed in the functional space. Initially, we chose N=N0/2 neurons that were located exclusively on one side of the x-axis of this space. We then proceeded to select N=N0/4 neurons from 4 quadrants. This sampling process was repeated iteratively, generating successively smaller subsets of neurons. (C, F) Random sampled (RSap) eigenspectra of ERM. ERM parameters: (A–C) Exponential function f(x⃗ )=e−∥x⃗ ∥/b where b=1 , ρ=10.24 and dimension d=2 . (D–F) Approximate power law Equation 11 with μ=0.5 , ρ=10.24 and dimension d=2 . Other parameters are the same as Figure 3. The standard error of the mean (SEM) across the clusters is represented by the shaded area of each line. |