
Fig. 6
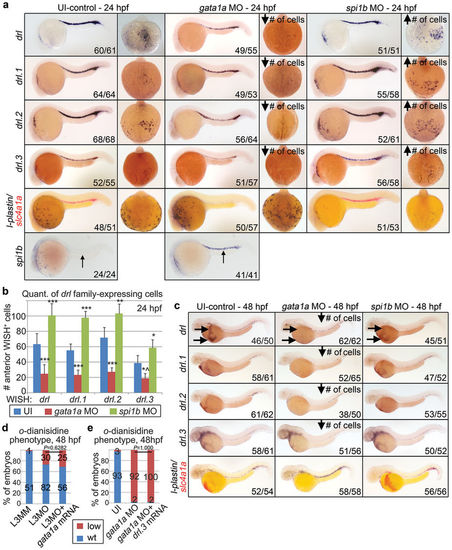
Loss of gata1a and spi1b affect drl gene family expression. (a) WISH of drl family members in gata1a and spi1b morphants (MO) compared to uninjected embryos at 24 hpf. From top to bottom: drl, drl.1, drl.2, drl.3, l-plastin (dark blue)/slc4a1a (red) and spi1b. Lateral views, head to the left (left panels); anterior, dorsal views (right panels). The number of the embryos with the representative phenotype out of the total number of embryos is indicated. Arrows in the panels showing dorsal views indicate an increase or decrease in the numbers of WISH+ cells. (b) Quantitation of the number of drl gene family-expressing cells in the anterior hematopoietic region of control (UI), gata1a morphants and spi1b morphants at 24 hpf. N = 10 for each column. Bar shows mean ± S.D. *P = 0.0013, **P = 0.0002, |
 and ***P ≤ 0.0001 (Student's t-test). (c) WISH of drl family members in the indicated embryos at 48 hpf. Embryos shown as lateral views. Horizontal arrows indicate the region where cells in circulation can be visualized. Downward facing arrows indicate decreased WISH+ cell numbers. (d) Percent of L3MM-injected, L3MO-injected, and L3MO/gata1a mRNA co-injected embryos that have normal (blue, wt) or low numbers of erythroid cells (red, *estimated ≤ 60% of normal) based on o-dianisidine staining at 48 hpf. (e) Quantitative analysis of uninjected, gata1a MO-injected, and gata1a MO/drl.3 mRNA co-injected embryos that have normal (blue, wt) or low numbers of erythroid cells (red, *) based on o-dianisidine staining at 48 hpf. (d–e) Numbers of embryos are indicated in the columns. Statistical significance was analyzed using Fisher's exact test.
| Genes: | |
|---|---|
| Fish: | |
| Knockdown Reagents: | |
| Anatomical Terms: | |
| Stage Range: | Prim-5 to Long-pec |
| Fish: | |
|---|---|
| Knockdown Reagents: | |
| Observed In: | |
| Stage Range: | Prim-5 to Long-pec |