|
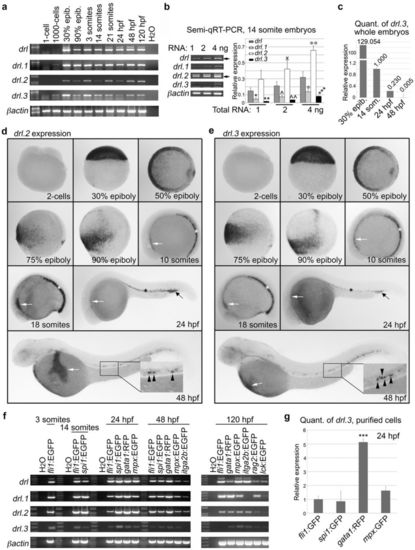
Drl gene family members are expressed throughout embryonic development and in multiple hematopoietic lineages. (a) RT-PCR analysis of the drl family members and β−actin from pooled embryos at the indicated ages. (b) Semi-quantitative (q) RT-PCR of drl genes and β-actin from pooled 14 somite stage embryos (left panel). Arrows indicate the bands that were used for quantitation, which is shown in the right panel. Compared to drl, *P = 0.0150, **P = 0.0052, , xP = 0.0360, , xP = 0.0360, , *P = 0.0142, **P = 0.0029 and ***P < 0.001 (Student's t-test). (c) Quantitative real-time PCR analysis of drl.3 in whole embryos at the indicated ages. The relative expression of drl.3 was normalized to the expression of gapdh. (d–e) WISH of drl.2 (d) and drl.3 (e) during embryonic development. Ages of embryos are indicated. Embryos at 2-cell and 30% epiboly stages are shown in a lateral view, animal pole at the top. 50% epiboly embryos are shown in an animal pole view, dorsal to the right. Embryos at 75% and 90% epiboly are shown as lateral views, dorsal to the right. Staged embryos at 10 somites, 18 somites, 24 and 48 hpf are shown as lateral views, anterior to the left. White arrows indicate ALM; asterisks indicate ICM; black arrows indicate PLM; arrowheads indicate AGM cells. Insets show magnified AGM region of corresponding embryo. (f) RT-PCR analysis of the drl family members and β−actin from purified populations of hematopoietic cells. The age of the embryos and the transgenic lines from which cells were purified are indicated. (g) Quantitative real-time PCR analysis of drl.3 in 24 hpf sorted hematopoietic cells. The relative expression of drl.3 was normalized to the expression of gapdh. ***P < 0.0001 (Student's t-test). (b–c, g) Bars show mean ± S.D. (a–b, f) Full-length gel images are provided in Supplemental Figure 8. , *P = 0.0142, **P = 0.0029 and ***P < 0.001 (Student's t-test). (c) Quantitative real-time PCR analysis of drl.3 in whole embryos at the indicated ages. The relative expression of drl.3 was normalized to the expression of gapdh. (d–e) WISH of drl.2 (d) and drl.3 (e) during embryonic development. Ages of embryos are indicated. Embryos at 2-cell and 30% epiboly stages are shown in a lateral view, animal pole at the top. 50% epiboly embryos are shown in an animal pole view, dorsal to the right. Embryos at 75% and 90% epiboly are shown as lateral views, dorsal to the right. Staged embryos at 10 somites, 18 somites, 24 and 48 hpf are shown as lateral views, anterior to the left. White arrows indicate ALM; asterisks indicate ICM; black arrows indicate PLM; arrowheads indicate AGM cells. Insets show magnified AGM region of corresponding embryo. (f) RT-PCR analysis of the drl family members and β−actin from purified populations of hematopoietic cells. The age of the embryos and the transgenic lines from which cells were purified are indicated. (g) Quantitative real-time PCR analysis of drl.3 in 24 hpf sorted hematopoietic cells. The relative expression of drl.3 was normalized to the expression of gapdh. ***P < 0.0001 (Student's t-test). (b–c, g) Bars show mean ± S.D. (a–b, f) Full-length gel images are provided in Supplemental Figure 8.
|