
FIGURE
Fig. 4
Fig. 4
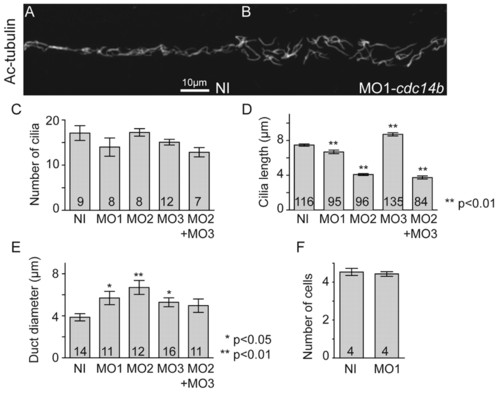
Cdc14B loss-of-function effect on kidney cilia. (A,B) Cilia in the kidney duct at 27 hpf visualized with an anti-Ac-tubulin antibody. (C,D) Cilia numbers (C) and length (D) were determined at 27 hpf. (E) Kidney duct diameter was measured at 27 hpf. (F) Number of cells in sections of the kidney tubules at 2.5 dpf. The numbers of embryos (C,E,F) and cilia (D) analyzed are indicated in each column. Data are mean ± s.e.m. Statistics were carried out using Student′s t-test. |
Expression Data
Expression Detail
Antibody Labeling
Phenotype Data
| Fish: | |
|---|---|
| Knockdown Reagents: | |
| Observed In: | |
| Stage: | Prim-5 |
Phenotype Detail
Acknowledgments
This image is the copyrighted work of the attributed author or publisher, and
ZFIN has permission only to display this image to its users.
Additional permissions should be obtained from the applicable author or publisher of the image.
Full text @ Development