|
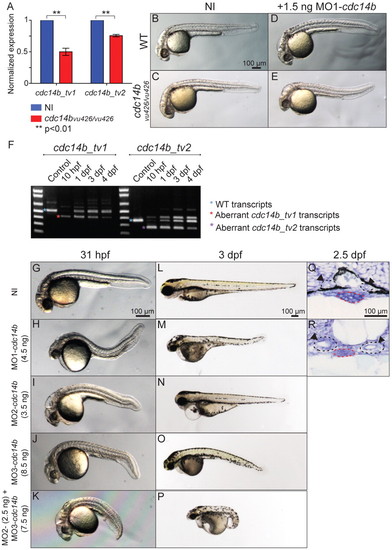
Morphological phenotype resulting from Cdc14B loss of function. (A) Quantitative RT-PCR comparing levels of cdc14b_tv1 and cdc14b_tv2 expression in wild-type and cdc14bvu426 homozygous mutant zebrafish embryos at 10 hpf. Data are mean ± s.e.m. Statistics were carried out using Student′s t-test. (B-E) Wild-type (B,D) and cdc14bvu426 homozygous mutant (C,E) non-injected (NI) control embryos (B,C) and injected with 1.5 ng of MO1-cdc14b (D,E). (F) RT-PCR showing the efficiency of 4.5 ng MO1-cdc14b. (G-P) Non-injected control and cdc14b MO-injected embryos/larvae at 31 hpf (G-K) and 3 dpf (L-P). (Q,R) Sections (5 μm) through the kidney of non-injected control (Q) and MO1-cdc14b-injected (R) larvae at 2.5 dpf. The medial tubules (arrowheads) and the gut are outlined in black and red, respectively.
|