
- Title
-
An atlas and database of neuropeptide gene expression in the adult zebrafish forebrain
- Authors
- Hiraki-Kajiyama, T., Miyasaka, N., Ando, R., Wakisaka, N., Itoga, H., Onami, S., Yoshihara, Y.
- Source
- Full text @ J. Comp. Neurol.
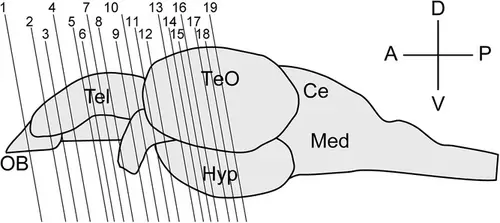
Schematic of the zebrafish brain viewed from the lateral side. The anterior is to the left, and the dorsal is to the top. Lines 1−19 indicate the locations of each plane in Figures 2-20. OB, olfactory bulb; TeO, optic tectum; Hyp, hypothalamus; Ce, cerebellum; Med, medulla oblongata; A, anterior; P, posterior; D, dorsal; V, ventral. |
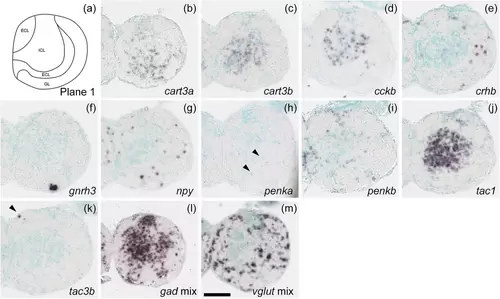
Schematic of plane 1 and photographs of ISH results of genes expressed in plane 1. Arrowheads indicate the locations of weak signals. Scale bar = 100 μm. |
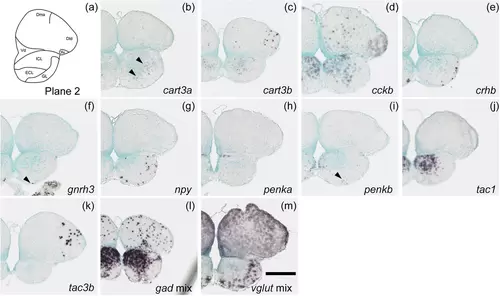
Schematic of plane 2 and photographs of ISH results of genes expressed in plane 2. Arrowheads indicate the locations of weak signals. Scale bar = 200 μm. |
Schematic of plane 3 and photographs of ISH results of genes expressed in plane 3. Arrowheads indicate the locations of weak signals. Scale bar = 200 μm. |
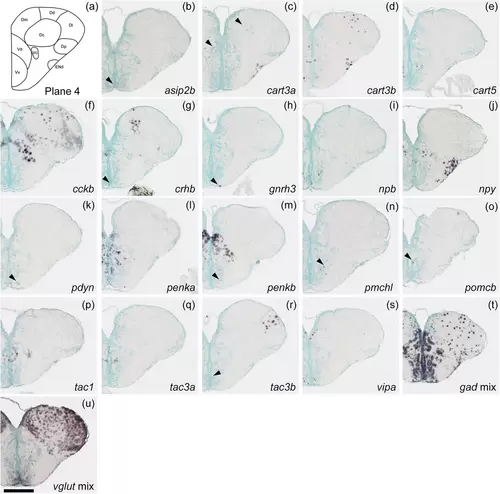
Schematic of plane 4 and photographs of ISH results of genes expressed in plane 4. Arrowheads indicate the locations of weak signals. Scale bar = 200 μm. |
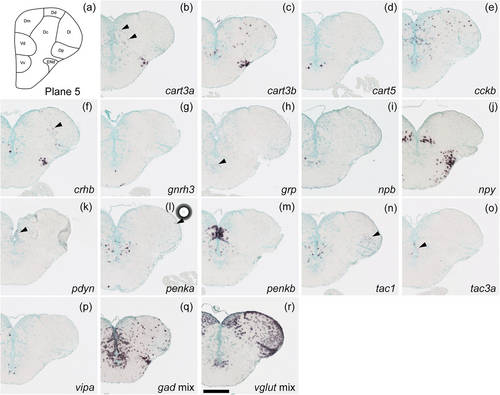
Schematic of plane 5 and photographs of ISH results of genes expressed in plane 5. Arrowheads indicate the locations of weak signals. Scale bar = 200 μm. |
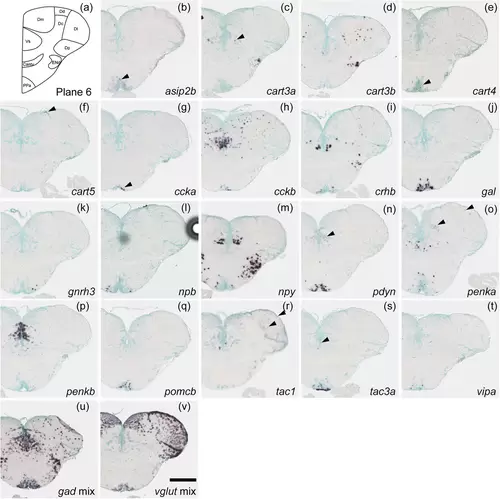
Schematic of plane 6 and photographs of ISH results of genes expressed in plane 6. Arrowheads indicate the locations of weak signals. Scale bar = 200 μm. |
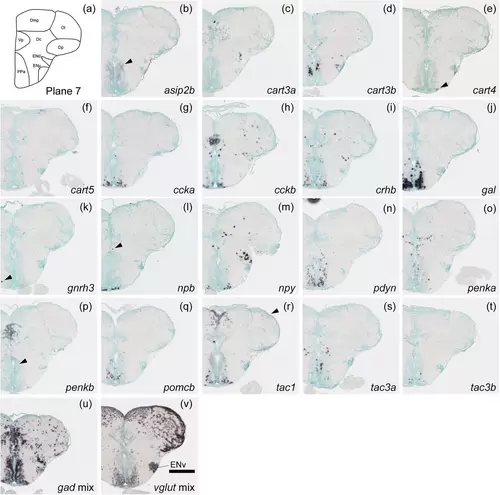
Schematic of plane 7 and photographs of ISH results of genes expressed in plane 7. Arrowheads indicate the locations of weak signals. Anatomical labels are added to photographs with orientations significantly different from the reference schematic. Scale bar = 200 μm. |
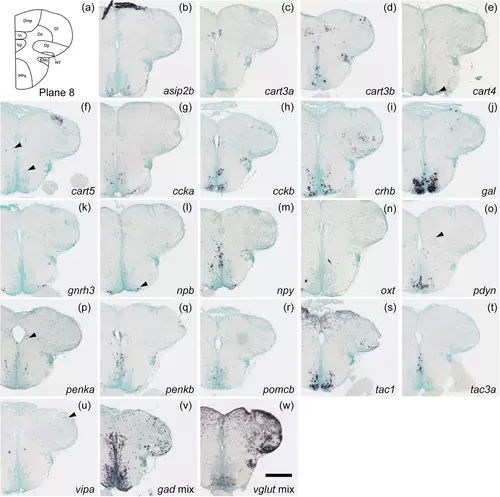
Schematic of plane 8 and photographs of ISH results of genes expressed in plane 8. Arrowheads indicate the locations of weak signals. Scale bar = 200 μm. |
Schematic of plane 9 and photographs of ISH results of genes expressed in plane 9. Arrowheads indicate the locations of weak signals. Scale bar = 200 μm. |

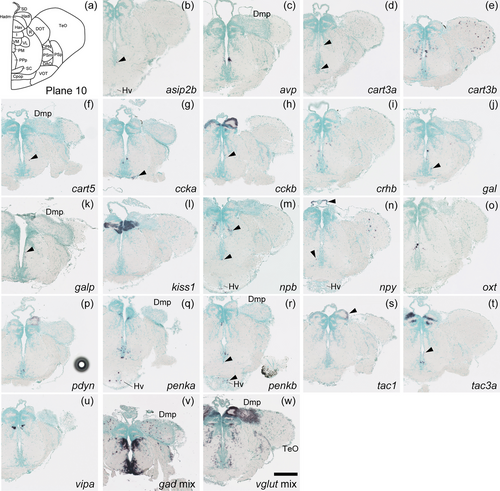
Schematic of plane 10 and photographs of ISH results of genes expressed in plane 10. Arrowheads indicate the locations of weak signals. Anatomical labels are added to photographs with orientations significantly different from the reference schematic. Scale bar = 200 μm. |
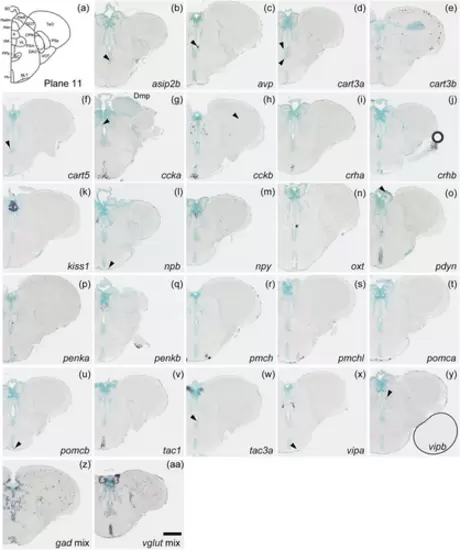
Schematic of plane 11 and photographs of ISH results of genes expressed in plane 11. Arrowheads indicate the locations of weak signals. Anatomical labels are added to photographs with orientations significantly different from the reference schematic. Scale bar = 200 μm. |
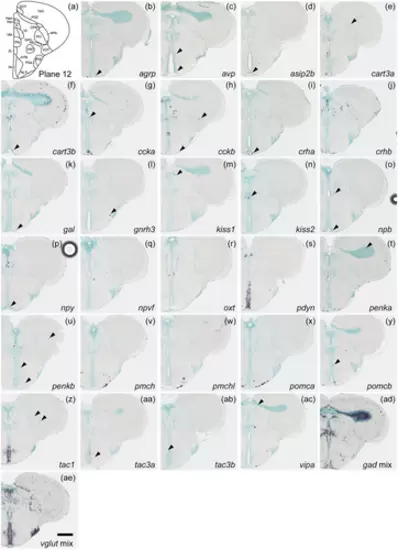
Schematic of plane 12 and photographs of ISH results of genes expressed in plane 12. Arrowheads indicate the locations of weak signals. Scale bar = 200 μm. |
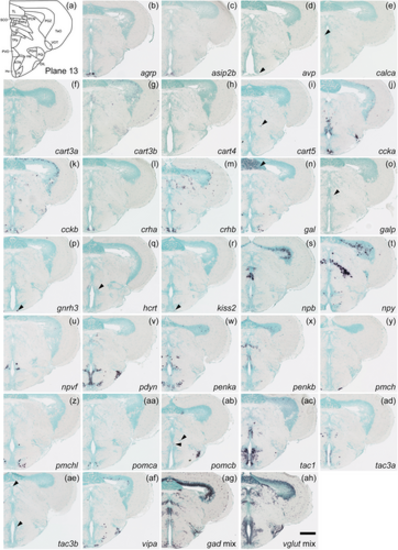
Schematic of plane 13 and photographs of ISH results of genes expressed in plane 13. Arrowheads indicate the locations of weak signals. Scale bar = 200 μm. |
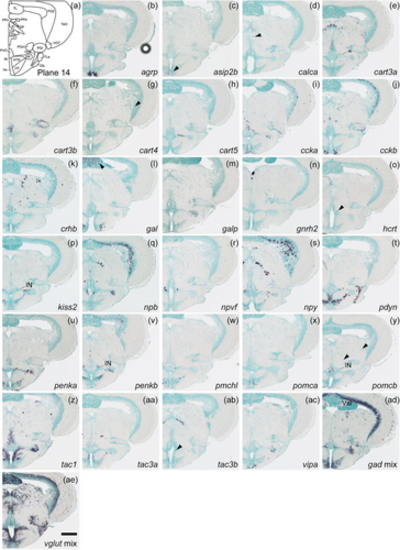
Schematic of plane 14 and photographs of ISH results of genes expressed in plane 14. Arrowheads indicate the locations of weak signals. Anatomical labels are added to photographs with orientations significantly different from the reference schematic. Scale bar = 200 μm. |
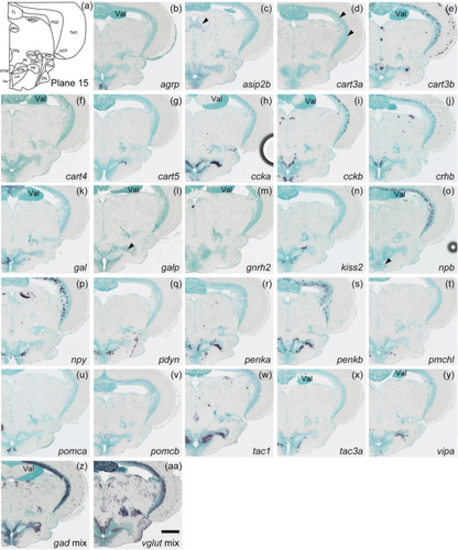
Schematic of plane 15 and photographs of ISH results of genes expressed in plane 15. Arrowheads indicate the locations of weak signals. Anatomical labels are added to photographs with orientations significantly different from the reference schematic. Scale bar = 200 μm. |
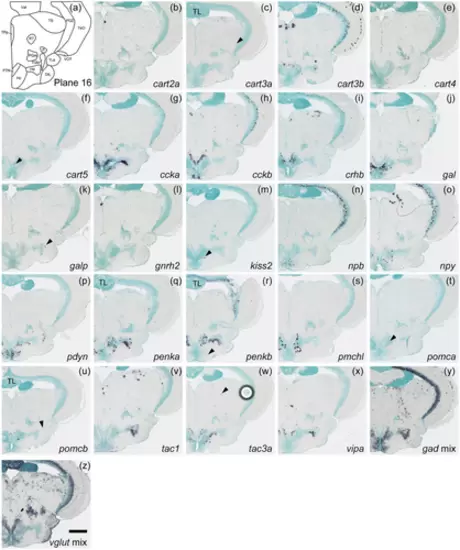
Schematic of plane 16 and photographs of ISH results of genes expressed in plane 16. Arrowheads indicate the locations of weak signals. Anatomical labels are added to photographs with orientations significantly different from the reference schematic. Scale bar = 200 μm. |
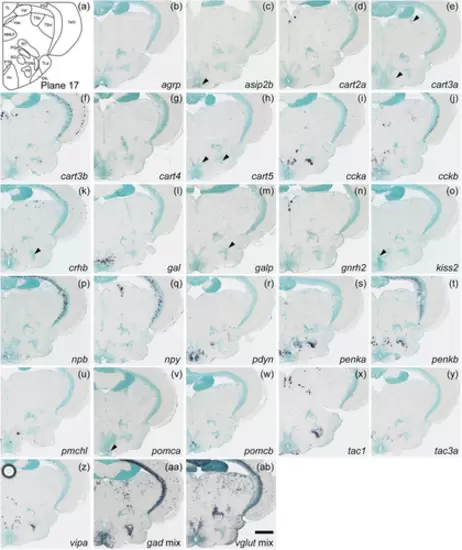
Schematic of plane 17 and photographs of ISH results of genes expressed in plane 17. Arrowheads indicate the locations of weak signals. Scale bar = 200 μm. |
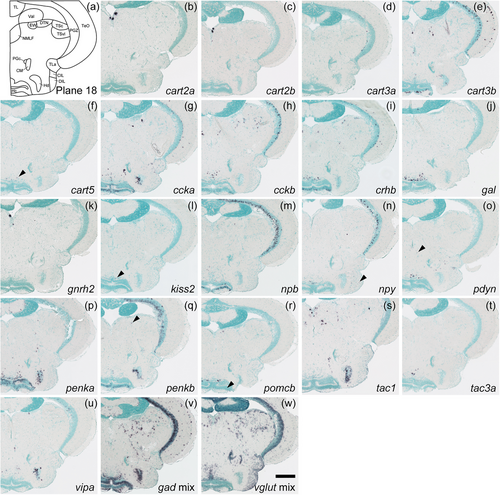
Schematic of plane 18 and photographs of ISH results of genes expressed in plane 18. Arrowheads indicate the locations of weak signals. Scale bar = 200 μm. |
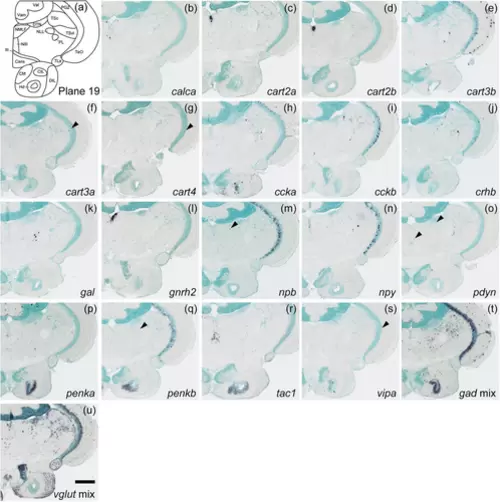
Schematic of plane 19 and photographs of ISH results of genes expressed in plane 19. Arrowheads indicate the locations of weak signals. Scale bar = 200 μm. |
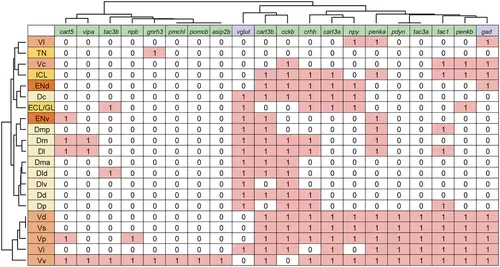
Comparison of neuropeptide expression patterns in the nuclei of the zebrafish telencephalon. Expression of neuropeptides (green) and neurotransmitter markers (purple) in the olfactory bulb (yellow), dorsal telencephalon (light yellow), ventral telencephalon (light orange), and entopeduncular nucleus (orange) were summarized (expressed = 1, not expressed = 0; for gad and vglut, the one that is expressed more = 1, the one that is expressed less = 0). Using Ward's method, the nuclei as well as neuropeptide and neurotransmitter marker genes were hierarchically clustered. |
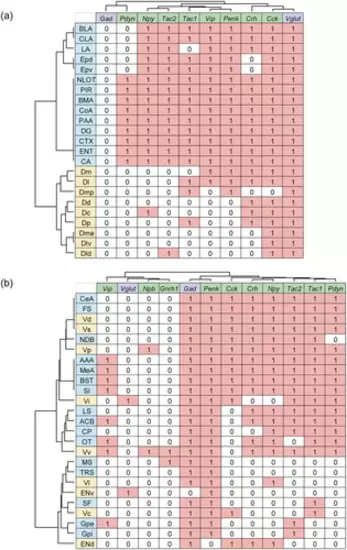
Comparison between zebrafish and mouse telencephalic nuclei based on their neuropeptide expression patterns. Expression of neuropeptides (green) and neurotransmitter markers (purple) in the nuclei of zebrafish (light yellow) and mice (light blue) were extracted from the present ISH results (zebrafish), the Allen Mouse Brain Atlas and previous articles (mouse) and summarized in a table (expressed = 1, not expressed = 0; for Gad and Vglut, the one that is expressed more = 1, the one that is expressed less = 0). Using Ward's method, the nuclei of zebrafish and mice, as well as neuropeptide and neurotransmitter marker genes were hierarchically clustered based on their expression profiles. (a) Comparison of pallial nuclei. (b) Comparison of subpallial nuclei. |
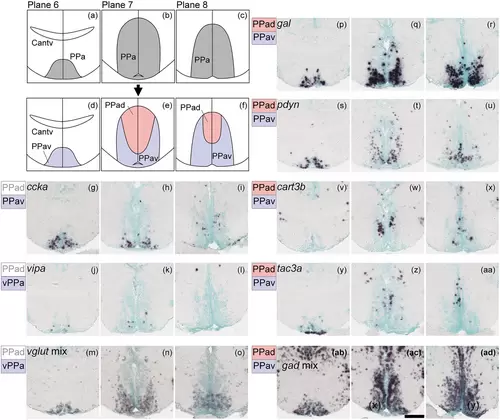
Subregions in the anterior part of the parvocellular preoptic nucleus (PPa). (a)–(c) The PPa (gray) in the zebrafish brain atlas of Wullimann et al. (1996). (d)–(f) The PPa can be divided into two subregions: the ventral part of PPa (PPav, pink) and dorsal part of PPa (PPad, purple). (g)–(o) Neuropeptides such as ccka and vipa and vglut mix are exclusively expressed in the PPav. (p)–(u) gal and pdyn are expressed in both the PPad and PPav, but predominantly in the PPav. (v)–(aa) cart3b and tac3a are also expressed in the PPav and PPad but predominantly in the PPad. (ab)–(ad) gad mix is expressed in both the PPad and PPav. Scale bar = 100 μm. |
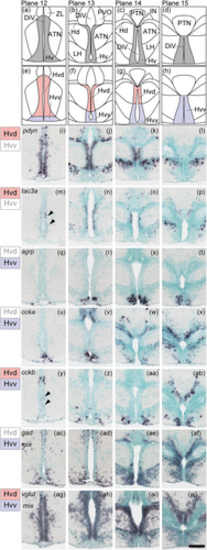
Subregions in the ventral zone of the periventricular hypothalamus (Hv). (a)–(d) The Hv (gray) in the zebrafish brain atlas of Wullimann et al. (1996). (e)–(h) The Hv can be divided into two subregions: the ventral part of Hv (Hvv, purple) and the dorsal part of Hv (Hvd, pink). (i)–(x) Neuropeptides such as pdyn and tac3a are expressed only in the Hvd, whereas agrp and ccka are expressed only in the Hvv. (y)–(ab) cckb is expressed in both the Hvd and Hvv. (ac)–(aj) gad mix is predominantly expressed in the Hvv and the vglut mix is more densely expressed in the Hvd. Arrowheads indicate the locations of weak signals. Scale bar = 100 μm. |
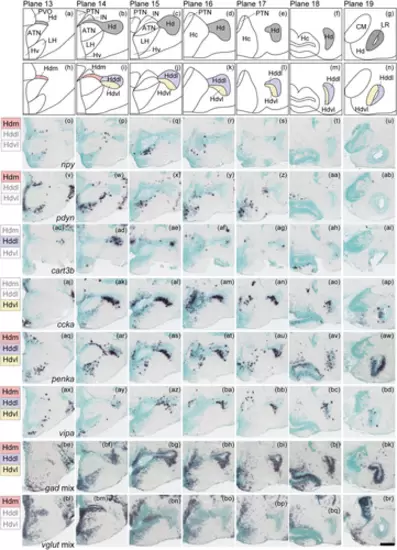
Subregions in the dorsal zone of the periventricular hypothalamus (Hd). (a)–(g) The Hd (gray) in the zebrafish brain atlas of Wullimann et al. (1996). (h)–(n) The Hd can be divided into three subregions: the medial (Hdm, pink), dorsolateral (Hddl, purple), and ventrolateral (Hdvl, yellow) part of Hd. (o)–(ap) Some neuropeptides are expressed solely in the Hdm, Hddl, or Hdvl (represented by npy, pdyn, cart3b, and ccka, respectively). (aq)–(bd) Neuropeptides such as penka and vipa are expressed in all three subregions. (be)–(bk) gad mix is also expressed in all subregions. (bl)–(br) vglut mix is solely expressed in Hdm. Scale bar = 100 μm. |
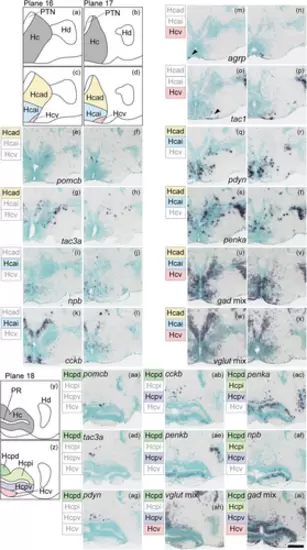
Subregions in the caudal zone of the periventricular hypothalamus (Hc). (a), (b) The anterior part of Hc (gray) in the zebrafish brain atlas of Wullimann et al. (1996). (c), (d) The anterior part of Hc can be divided into three subregions: the anterodorsal (Hcad, yellow), anterointermediate (Hcai, blue), ventral (Hcv, pink) part of Hc. (e)–(h) Neuropeptides such as pomcb and tac3a are solely expressed in the Hcad. (i)–(l) Neuropeptides such as npb and cckb are expressed exclusively in the Hcai. (m)–(p) agrp and tac1 are only expressed in the Hcv. (q)–(t) Neuropeptides such as pdyn and penka are expressed across multiple subregions. (u)–(x) gad mix and vglut mix are expressed in all three subregions. (y) Posterior part of Hc (gray) in the zebrafish brain atlas of Wullimann et al. (1996). (z) The posterior part of Hc can be divided into four subregions: the posterodorsal (Hcpd, green), posterointermediate (Hcpi, light green), posteroventral (Hcpv, purple), and ventral (Hcv, pink) part of Hc. (aa), (ad), (ag) Neuropeptides such as pomcb, tac3a, and pdyn are solely expressed in the Hcpd. (ab), (ae) cckb and penkb are expressed in the Hcpd and Hcpv. (ah) vglut mix is expressed in Hcpd, Hcpv, and Hcv. (ac), (af) penka and npb are expressed in the Hcpd, Hcpi, and Hcpv. (ai) gad mix is expressed in all regions. Arrowheads indicate the location of weak signals. Scale bar = 100 μm. |
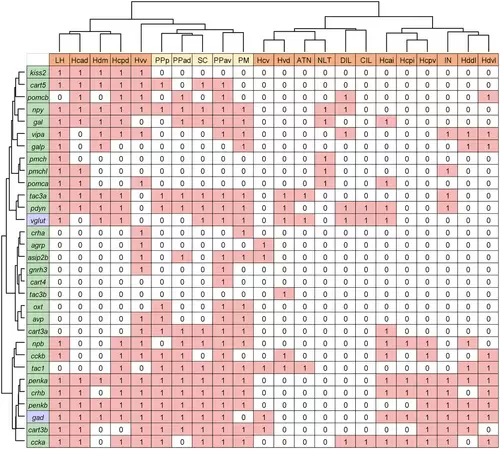
Cluster analysis of nuclei in the zebrafish hypothalamus by gene expression profile. The expression of neuropeptides (green) and neurotransmitter markers (purple) in the preoptic area (light yellow) and hypothalamus (orange) is summarized in a table (expressed = 1, not expressed = 0; for gad and vglut, the one that is expressed more = 1, the one that is expressed less = 0). Using Ward's method, the nuclei were hierarchically clustered based on their expression profiles. |
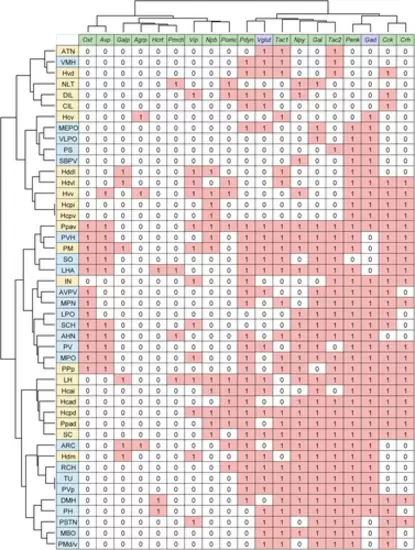
Comparison between zebrafish and mouse hypothalamic nuclei based on their neuropeptide expression patterns. Expression of neuropeptides (green) and neurotransmitter markers (purple) in the hypothalamic nuclei of zebrafish (light yellow) and mice (light blue) was extracted from the present ISH results (zebrafish), the Allen Mouse Brain Atlas, and previous articles (mouse) and summarized in a table (expressed = 1, not expressed = 0; for Gad and Vglut, the one that is expressed more = 1, the one that is expressed less = 0). Using Ward's method, the nuclei of zebrafish and mice, as well as neuropeptide and neurotransmitter marker genes were hierarchically clustered based on their expression profiles. |
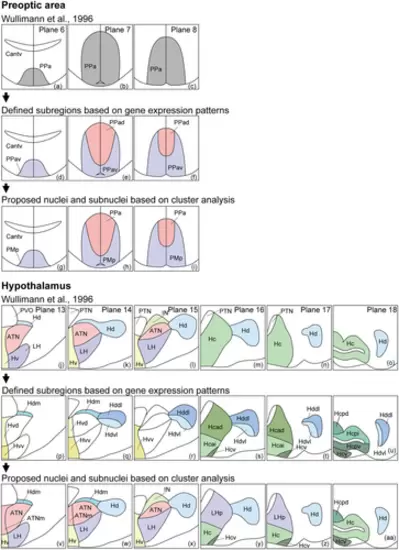
Proposed rearrangement of the preoptic and hypothalamic nuclei and subnuclei in zebrafish based on gene expression. (a)–(c) PPa (gray) in the zebrafish brain atlas of Wullimann et al. (1996). (d)–(f) According to gene expression patterns, PPa was divided into two subregions, PPad and PPav. (g)–(i) The cluster analysis results suggest that PPav is more similar to PM in gene expression and should therefore be called PMp. (j)–(o) Periventricular hypothalamic nuclei in the zebrafish brain atlas of Wullimann et al. (1996). (p)–(u) Based on gene expression patterns, we have classified the hypothalamus into finer subregions. (v)–(aa) Rearrangement of nuclei and subnuclei was proposed based on the results of cluster analysis. |