
Image
|
Figure Caption
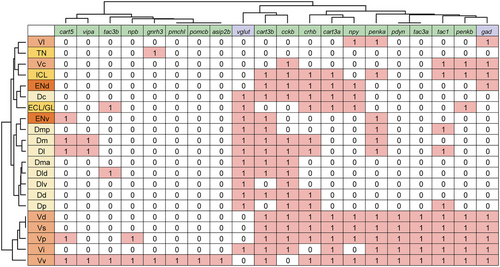
Fig. 21 Comparison of neuropeptide expression patterns in the nuclei of the zebrafish telencephalon. Expression of neuropeptides (green) and neurotransmitter markers (purple) in the olfactory bulb (yellow), dorsal telencephalon (light yellow), ventral telencephalon (light orange), and entopeduncular nucleus (orange) were summarized (expressed = 1, not expressed = 0; for gad and vglut, the one that is expressed more = 1, the one that is expressed less = 0). Using Ward's method, the nuclei as well as neuropeptide and neurotransmitter marker genes were hierarchically clustered.
Acknowledgments
This image is the copyrighted work of the attributed author or publisher, and
ZFIN has permission only to display this image to its users.
Additional permissions should be obtained from the applicable author or publisher of the image.
Full text @ J. Comp. Neurol.