
Image
|
Figure Caption
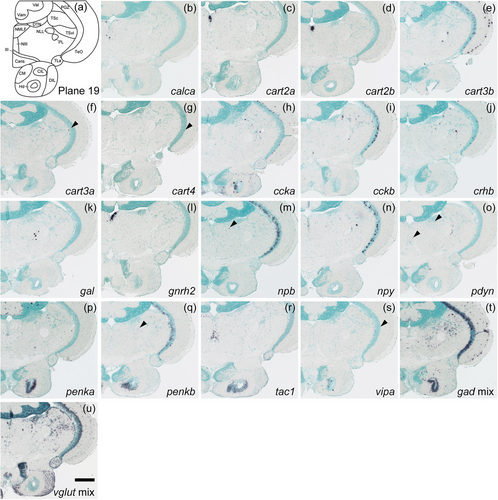
Fig. 20 Schematic of plane 19 and photographs of ISH results of genes expressed in plane 19. Arrowheads indicate the locations of weak signals. Scale bar = 200 μm.
Acknowledgments
This image is the copyrighted work of the attributed author or publisher, and
ZFIN has permission only to display this image to its users.
Additional permissions should be obtained from the applicable author or publisher of the image.
Full text @ J. Comp. Neurol.