
Fig. 22
- ID
- ZDB-FIG-240620-139
- Publication
- Hiraki-Kajiyama et al., 2024 - An atlas and database of neuropeptide gene expression in the adult zebrafish forebrain
- Other Figures
- All Figure Page
- Back to All Figure Page
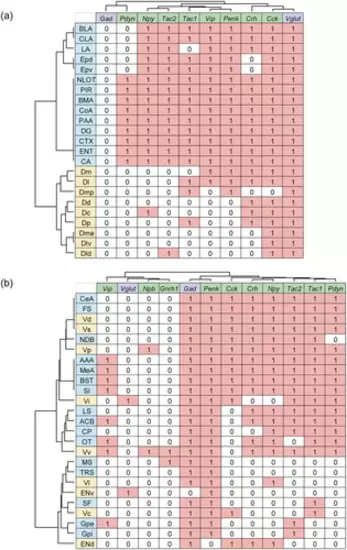
Comparison between zebrafish and mouse telencephalic nuclei based on their neuropeptide expression patterns. Expression of neuropeptides (green) and neurotransmitter markers (purple) in the nuclei of zebrafish (light yellow) and mice (light blue) were extracted from the present ISH results (zebrafish), the Allen Mouse Brain Atlas and previous articles (mouse) and summarized in a table (expressed = 1, not expressed = 0; for Gad and Vglut, the one that is expressed more = 1, the one that is expressed less = 0). Using Ward's method, the nuclei of zebrafish and mice, as well as neuropeptide and neurotransmitter marker genes were hierarchically clustered based on their expression profiles. (a) Comparison of pallial nuclei. (b) Comparison of subpallial nuclei. |