
- Title
-
Single-cell analysis of Rohon-Beard neurons implicates Fgf signaling in axon maintenance and cell survival
- Authors
- Tuttle, A.M., Miller, L.N., Royer, L.J., Wen, H., Kelly, J.J., Calistri, N.L., Heiser, L.M., Nechiporuk, A.V.
- Source
- Full text @ J. Neurosci.
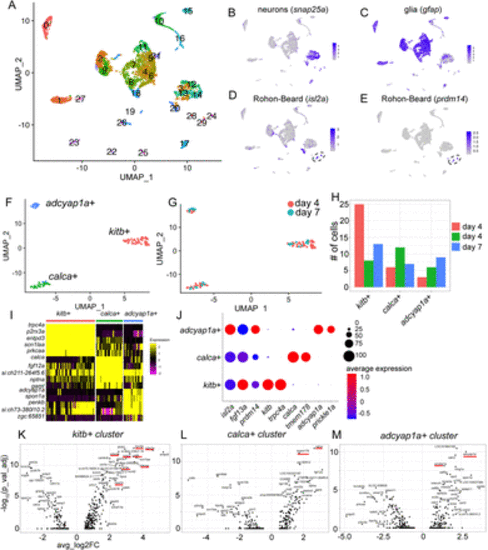
Identification of transcriptionally distinct RB subpopulations. A, Unsupervised clustering and UMAP reduction diagram of cells derived from trunks of day 4 (Kelly et al., 2023) and day 7 larvae. B,C, Feature plots identifying neurons (B) and glia (C). D,E, Feature plots of two RB markers, isl2a and prdm14, identifying clusters 24 and 29 as RBs. F,G, Unsupervised subclustering and UMAP reduction diagram of RB cells. H, Bar plot showing cell numbers for each cluster. I, Heat map showing top five DE genes for each cluster. J, Dot plot profile of genes expressed in all RBs (isl2a, fgf13a, and prdm14), kitb+ cluster (kitb and trpc4a), calca+ cluster (calca and tmem178), and adcyap1a+ cluster (adcyap1a and prickle1a). K–M, Volcano plots showing top DE genes in each RB cluster. |
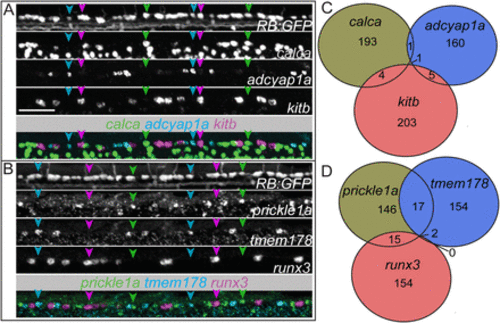
Marker expression for individual RB neuron subpopulations is largely exclusive. A,B, Lateral view of triple fluorescence in situ hybridization (FISH) in RB:GFP+ RB neurons in a single 72 hpf larva. A, RNAscope for kitb (magenta arrowheads), adcyap1a (cyan arrowheads), and calca (green arrowheads), and (B) prickle1a (green arrowheads), tmem178 (cyan arrowheads), and runx3 (magenta arrowheads) mark largely nonoverlapping sets of RBs. C,D, Summed counts of RB markers from the triple FISH experiments. Scale bar = 50 μm. |
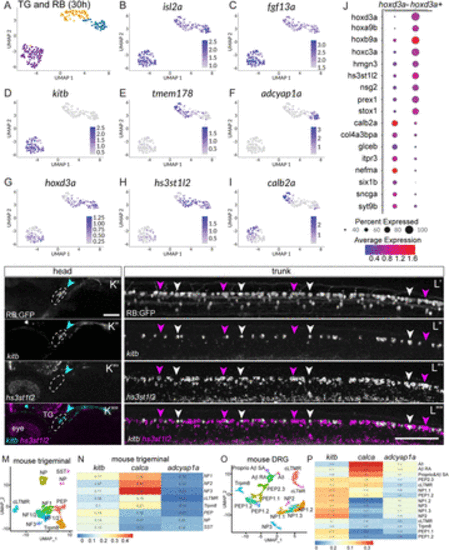
Comparison of RB and TG transcriptional profiles. A, Unsupervised clustering and UMAP reduction diagram of TG and RB cells derived from 30 hpf TgBAC(neurod1:egfp)nl1 embryos yield three cell clusters containing both TG and RB cells. B,C, Feature plots demonstrating isl2a and fgf13a mark both TG and RB cells. D–F, Feature plots showing presence of RB markers in RB and TG cells. G, Expression of a posterior hox gene, hoxd3a, marks RB cells. H, Feature plot of an RB-specific marker, hs3st1l2. I, Feature plot of a TG-specific marker calb2a. J, Dot plot showing expression of posterior hox genes as well as RB-specific markers (hoxd3a+ subset) and TG-specific markers (hoxd3a− subset). K,L, Lateral views of FISH staining for kitb (magenta arrowheads) and hs3st1l2 (white arrowheads) at 72 hpf in RB (K) or TG (L) neurons marked in RB:GFP larva. Note that subpopulations of RB neurons are positive for kitb or hs3st1l2 while no TG neurons express hs3st1l2. Dashed lines = TG. M, Unsupervised clustering and UMAP reduction diagram of adult mouse TG cells (Yang et al., 2022). N, Heatmap illustrating module scores for each RB cluster that are associated with each type of mouse TG neurons. Note the calca+ RB cluster is most similar to NF3 TG neurons. O, Unsupervised clustering and UMAP reduction diagram of adult mouse DRG cells (Jung et al., 2023). P, Heatmap illustrating module scores for each RB cluster that are associated with each type of mouse DRG neurons. Note the calca+ RB cluster is most similar to Aδ DRG neurons. Scale bar = 100 μm. |
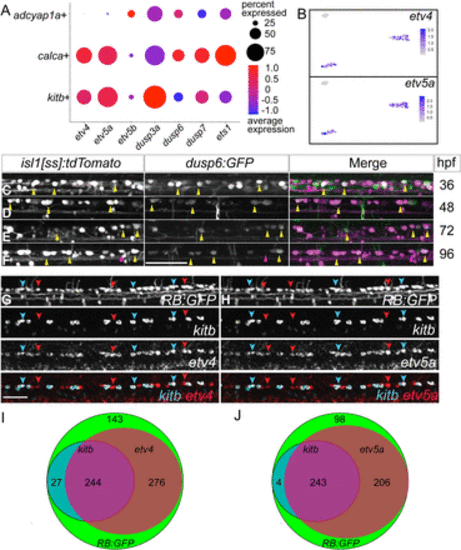
RBs express canonical downstream Fgf-signaling targets. A, Dot plot shows expression of canonical Fgf targets in all three RB clusters. B, Feature plots of two Fgf targets, etv4 and etv5a, show expression in kitb+ and calca+ clusters from the UMAP depicted in Figure 1F. C–F, Lateral views of dorsal neurons of live isl1[ss]:tdTomato; dusp6:GFP larvae at 36, 48, 72 and 96 hpf. Note that many RBs are GFP+ indicating active canonical Fgf signaling at these stages. G,H, Lateral views of FISH staining in RB:GFP larvae at 72 hpf for expression of kitb (cyan arrowheads) and downstream Fgf signaling targets (G) etv4 (red arrowheads) or (H) etv5a (red arrowheads). Yellow arrowheads = dusp6+ RBs, Red arrowheads = dusp6− RBs, scale bars = 50 μm. I,J, Summed counts of RB markers in larvae with respective sets of FISH probes visualized in (G,H) (N = 690 and 551, respectively). The majority of RBs express etv4 or etv5a and nearly all kitb+ RBs express etv4/etv5a. |
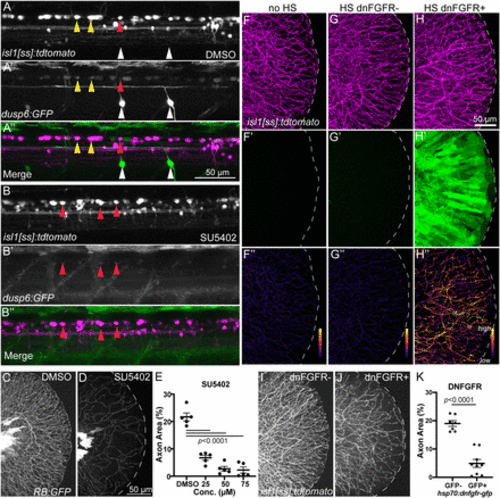
Inhibition of Fgf signaling induces loss of established sensory axons. A,B, Lateral views of isl1[ss]:tdTomato; dusp6:eGFP dorsal neurons in DMSO- (A) and SU5402-treated (B) 4 dpf larvae. Many RB neurons and motor neurons are GFP+ in DMSO-treated larvae but SU5402 treatment leads to loss of almost all GFP signal in dorsal neurons. Yellow arrowheads = GFP+ RB neurons, red arrowheads = GFP− RB neurons, white arrowheads = GFP+ motor neurons. C,D, Lateral views of RB:GFP caudal tails at 5 dpf treated for 48 h with 50 μM SU5402 (D), an Fgfr inhibitor, displayed substantial loss of RB axons in the tail compared to DMSO controls (C). E, Quantification of the dose-dependent effect of SU5402 on tail axon density. DMSO = 21.7 ± 1.5%, 25 μM = 6.7 ± 0.9%, 50 μM = 2.7 ± 0.9%, 75 μM = 2.3 ± 1.1%, analyzed by one-way ANOVA with post hoc Tukey's test (F = 68.46, p < 0.0001). F–H, Lateral views of caudal tails in isl1[ss]:tdTomato larvae following 30 min heat-shock. (F’–H’) EGFP channel. (F’’–H’’) Masked images showing axon-only EGFP expression. Compared to larvae without the hsp70:dn-fgfr1-EGFP transgene (F) or larvae with the dn-FGFR1 transgene that were not heat-shocked (G), hsp70:dn-fgfr1-EGFP+ larvae that underwent heatshock displayed detectable EGFP signal both throughout the tail tissue (H’) and specifically in isl1[ss]:tdTomato-labeled axons (H’’). I,J, Lateral view of isl1[ss]:tdTomato+ control (I) and isl1[ss]:tdTomato; hsp70:dn-fgfr1-GFP+ (J) caudal tails heatshocked at 4 dpf and imaged at 5 dpf. Compared to control (I), hsp70:dn-fgfr1-GFP+ larvae (J) had a reduction in RB axons similar to SU5402 treatment. K, Quantification of tail axon-density following heat-shock. Dnfgfr1-gfp− = 19.0 ± 1.0%, dnfgfr1-fgp+ = 4.9 ± 1.4%, analyzed by t test. |
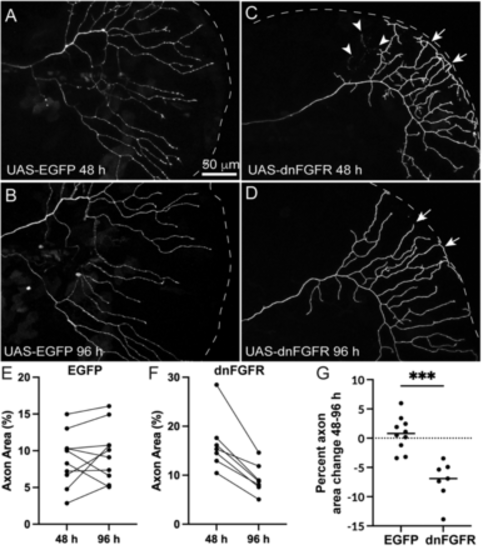
Cell autonomous loss of Fgf signaling in RB neurons induces loss of axon density. A–D, Live-images of RB axons in the caudal tail mosaically expressing UAS-EGFP or UAS-dnfgfr1-EGFP in RB:RFP larvae from 48 hpf (A,C) to 96 hpf (B,D). E,F, Quantification of axon area % from 48 to 96 hpf from individual larvae injected with UAS-EGFP (C) or UAS-dnfgfr1-EGFP. Arrowheads mark sites of axon degeneration, whereas arrows mark axon terminals that lose elaboration over time. EGFP = 48 h = 8.83 ± 1.2%, 96 h = 9.6 ± 1.6%, p = 0.42, paired t test. dnfgfr = 16.5 ± 2.2%, 9.3 ± 1.2%, p = 0.001, paired t test. G, Comparison of change in axon area % of EGFP versus dnFgfr1-expressing RB axons from 48 to 96 hpf. EGFP = 0.7 ± 0.9%, dnFGFR = −7.7 ± 0.9, p = 0.0001, unpaired t test. |
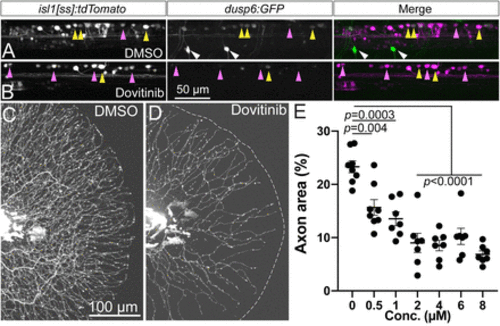
Dovitinib induces RB axon loss and reduction in Fgf signaling similar to SU5402 treatment. A,B, Lateral view of isl1[ss]:tdTomato; dups6:eGFP dorsal neurons in live 4 dpf larvae. Compared to DMSO-treated controls (A), short-term (7 h) dovitinib treatment (B) induced a substantial loss of Fgf signaling-dependent GFP expression. C,D, Lateral view of RB:GFP larval caudal tails at 5 pf following 48 h DMSO (C) or dovitinib (D) treatment. Dovitinib treatment led to major axon loss similar to genetic and pharmacological loss of Fgfr signaling. E, Quantification of dose-dependent effect of dovitinib on tail axon density. DMSO = 23.3 ± 1.1%, 0.5 μM = 15.7 ± 1.5%, 1 μM = 13.5 ± 1.3%, 2 μM = 9.0 ± 1.8%, 4 μM = 8.5 ± 1.0%, 6 μM = 10.2 ± 1.5%, 8 μM = 6.9 ± 0.6%, analyzed by one-way ANOVA with post hoc Tukey's test (F = 19.61, p < 0.0001). Yellow arrowheads = EGFP+ RB neurons, magenta arrowheads = EGFP− RB neurons, white arrowheads = EGFP+ motor neurons. |
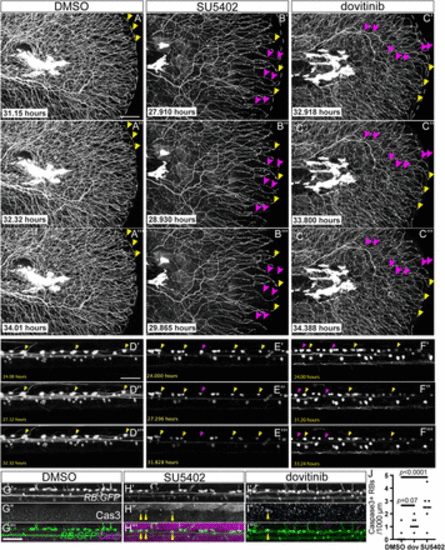
Fgf inhibition and dovitinib treatment induce Wallerian-like axon degeneration and RB neuron apoptosis. A–C, Stills from time-lapse movies of larval RB:GFP caudal tails treated with DMSO (A), SU5402 (B), or dovitinib (C). Yellow arrowheads = maintained axon terminals, magenta arrowheads = degenerating axons. D–F, Stills from time lapse movies of larval RB:GFP dorsal neurons demonstrating RB apoptosis. Yellow arrowheads = surviving RB neurons, magenta arrowheads = RB neurons undergoing apoptosis. G–I, Lateral view of RB:GFP dorsal neurons immunostained for cleaved Caspase-3 to mark apoptosis (yellow arrowheads). Compared to DMSO-treated larvae (G), SU5402 (H), and dovitinib (I). Scale bars = 50 μm. I, treatment displayed Cas3+ RB neurons. J, Quantification of RB neuron apoptosis detected by Cas3+ immunostaining. DMSO = 0 ± 0.2 RB neurons, dovitinib = 1.2 ± 0.2, SU5402 = 2.6 ± 0, analyzed by one-way ANOVA with post hoc Tukey's test (F = 07.81, p = 0.0013). Scale bars = 50 μm. |
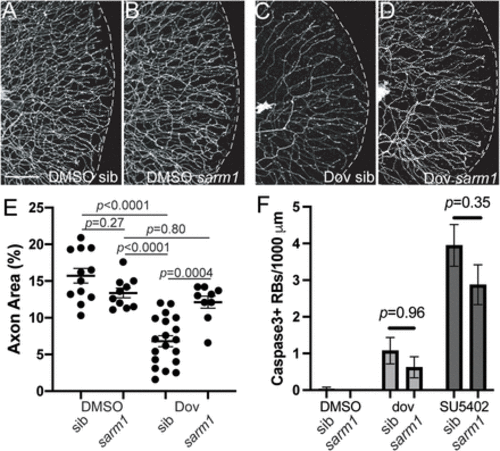
Sarm1 mediates dovitinib-induced axon degeneration. A–D, Lateral views of RB:GFP caudal tails at 5 dpf of wild-type (A,C) or sarm1−/− mutants (B,D) treated with DMSO or dovitinib (3–5 dpf treatment). Compared to wildtype siblings treated with dovitinib, sarm1 mutants had substantially higher GFP+ RB axon density. Scale bar = 50 μm. E, Quantification of axon density in dovitinib treatment of sarm1 mutants. DMSO sib = 15.7 ± 1.0%, DMSO sarm1 13.4 ± 0.7%, dovitinib sib = 6.8 ± 0.8%, dovitinib sarm1 = 12.1 ± 0.8. Analysis by 2-way ANOVA with Tukey's multiple-comparisons test revealed there was a significant interaction between drug treatment and sarm1 genotype (F(1,46) = 18.82, p < 0.0001) and simple main effects analysis showed drug treatment had a significant effect (p < 0.0001) but sarm1 genotype did not (p = 0.10). F, Quantification of RB apoptosis with dovitinib and SU5402 treatments of sarm1 mutants. Sarm1 mutants did not have significantly different numbers of Cas3+ RBs than siblings. DMSO sib = 0.0 ± 0.0, N = 17, DMSO sarm1 = 0.0 ± 0.0, N = 22, dovitinib sib = 1.1 ± 0.4, N = 22, dovitinib sarm1 = 0.6 ± 0.3, N = 19. SU5402 sib = 4.0 ± 0.6, N = 21, SU5402 sarm1 = 2.9 ± 0.5, N = 23. Analysis by 2-way ANOVA with Tukey's multiple-comparisons test revealed there was no significant interaction between drug treatment and sarm1 genotype (F(2,188) = 0.88, p = 0.42) and simple main effects analysis showed drug treatment did have a significant effect (p < 0.0001) but sarm1 genotype did not have a significant effect (p = 0.11). |