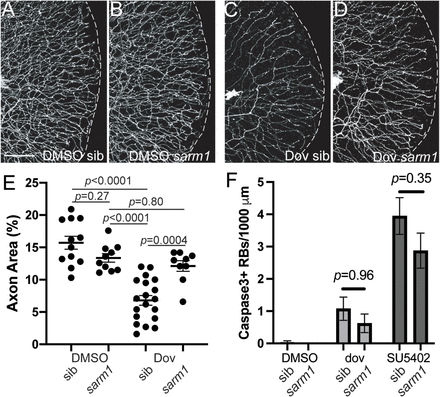
Fig. 9 Sarm1 mediates dovitinib-induced axon degeneration. A–D, Lateral views of RB:GFP caudal tails at 5 dpf of wild-type (A,C) or sarm1−/− mutants (B,D) treated with DMSO or dovitinib (3–5 dpf treatment). Compared to wildtype siblings treated with dovitinib, sarm1 mutants had substantially higher GFP+ RB axon density. Scale bar = 50 μm. E, Quantification of axon density in dovitinib treatment of sarm1 mutants. DMSO sib = 15.7 ± 1.0%, DMSO sarm1 13.4 ± 0.7%, dovitinib sib = 6.8 ± 0.8%, dovitinib sarm1 = 12.1 ± 0.8. Analysis by 2-way ANOVA with Tukey's multiple-comparisons test revealed there was a significant interaction between drug treatment and sarm1 genotype (F(1,46) = 18.82, p < 0.0001) and simple main effects analysis showed drug treatment had a significant effect (p < 0.0001) but sarm1 genotype did not (p = 0.10). F, Quantification of RB apoptosis with dovitinib and SU5402 treatments of sarm1 mutants. Sarm1 mutants did not have significantly different numbers of Cas3+ RBs than siblings. DMSO sib = 0.0 ± 0.0, N = 17, DMSO sarm1 = 0.0 ± 0.0, N = 22, dovitinib sib = 1.1 ± 0.4, N = 22, dovitinib sarm1 = 0.6 ± 0.3, N = 19. SU5402 sib = 4.0 ± 0.6, N = 21, SU5402 sarm1 = 2.9 ± 0.5, N = 23. Analysis by 2-way ANOVA with Tukey's multiple-comparisons test revealed there was no significant interaction between drug treatment and sarm1 genotype (F(2,188) = 0.88, p = 0.42) and simple main effects analysis showed drug treatment did have a significant effect (p < 0.0001) but sarm1 genotype did not have a significant effect (p = 0.11).
Image
Figure Caption
Acknowledgments
This image is the copyrighted work of the attributed author or publisher, and
ZFIN has permission only to display this image to its users.
Additional permissions should be obtained from the applicable author or publisher of the image.
Full text @ J. Neurosci.

