
- Title
-
YULINK regulates vascular formation in zebrafish and HUVECs
- Authors
- Lin, H.H., Kuo, M.W., Fan, T.C., Yu, A.L., Yu, J.
- Source
- Full text @ Biol. Res.
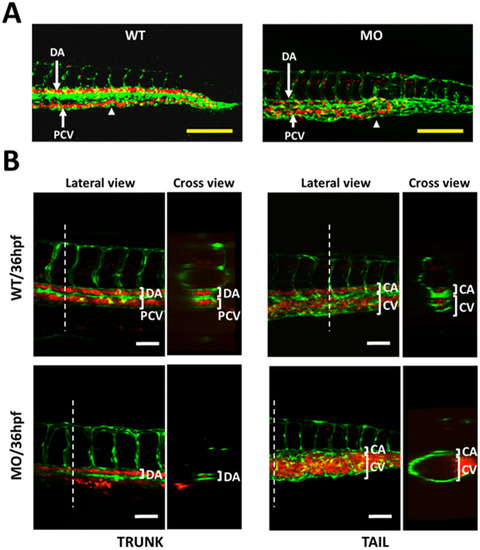
Effects of YULINK knockdown on the vasculature in zebrafish embryos. A The double transgenic zebrafish Tg (fli1:EGFP; gata1:DsRed) displayed fli1 promoter-derived green fluorescent for endothelial cells and gata1 promoter-derived red fluorescent for erythrocytes. Arrows indicate the anus of the embryo. Yellow scale bars indicate 200 μm. B The confocal images of the trunk and caudal vasculature at 36 hpf are shown with their lateral and cross-section views. The white dotted lines indicate the position where the cross-sections were taken. DA dorsal aorta, PCV posterior cardinal vein, CA caudal artery, CV caudal vein. White scale bars indicate 50 μm |
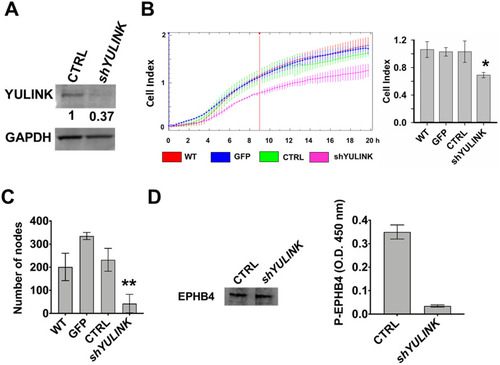
Effects of YULINK-knockdown on formation of capillary-like tubes, migration, and level of phosphorylated EPHB4 in HUVECs. HUVECs were transfected with plasmids containing GFP, vector-control (CTRL), or YULINK shRNA (shYULINK) for 1 day. A The knockdown efficiency of YULINK shRNA was analyzed at 1 day after transfection in Western blot using anti- YULINK antibody. GAPDH was used as a loading control. The intensity of the YULINK band was quantified and normalized to the GAPDH. B Real-time cell migration of the transfected cells was measured using CIM plates in the xCELLigence DP system, which detects the impedance across a cell-permeable membrane. HUVECs were transfected with plasmids containing GFP, vector-control (CTRL), or YULINK shRNA (shYULINK). All cells were seeded (1.6 × 10⁴ cells/well) and allowed to migrate for 20 h (left panel). Cell migration activity, expressed as cell index, was determined 9 h later (right panel, mean ± SD, n = 3, *p < 0.05). WT, wild type untreated cells. C Number of nodes were measured in transfected cells determined using a Matrigel-embedded tube forming assay (mean ± SD, n = 3, **p < 0.001). D Expression of the venous marker EPHB4 in total cell lysates was examined by Western blot and served as the internal control (left panel). Expression of phosphorylation EPHB4 was examined by ELISA (right panel). The ELISA optical density (O.D.) was determined at the visible wavelength 450 nm (mean ± SD, n = 6, **p < 0.001) |
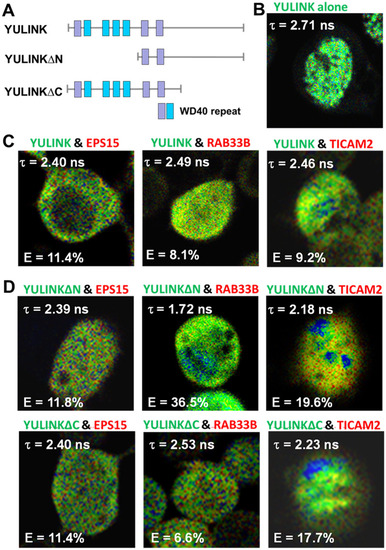
FLIM-FRET analysis of proteins interacting with YULINK. A Plasmid construct for full-length YULINK protein containing four conserved WD40 repeats (blue) and 3 potential WD40 candidates (purple). Other plasmid constructs for truncated forms of N- or C-termini (YULINK∆N or YULINK∆C) are also shown. B–D To validate these interactions, YULINK (full-length or truncated forms) was conjugated with AcGFP and the interacting protein candidates, EPS15, RAB33B, or TICAM2, were conjugated with DsRed, separately. Then, they were co-expressed in HEK-293 T cells and the FRET (Förster Resonance Energy Transfer) of AcGFP was measured using multi-photon fluorescence lifetime imaging microscopy (FLIM). The mean fluorescence lifetime (τ) and the FRET efficiency E (%) were measured at 48 h after co-transfection of HEK-293 T cells with AcGFP-YULINK (full-length or truncated forms) and DsRed-EPS15, DsRed-RAB33B, or DsRed-TICAM2, respectively. The less mean fluorescence lifetime (τ) and more FRET efficiency E (%) indicated stronger interaction and shorter distance between AcGFP and DsRed. The fluorescence lifetime (τ) of cells expressing only AcGFP-YULINK was as a FLIM-FRET control |
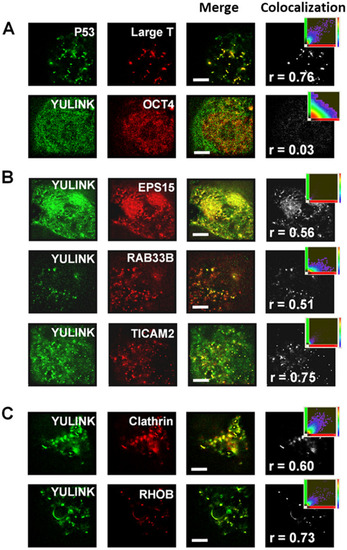
Analysis of colocalization using super-resolution microscopy. A, B The HEK-293 T cells co-expressing AcGFP-YULINK (green) and DsRed conjugates of the proteins of interest (red) were analyzed for colocalization ratio using super-resolution microscopy at 2 days after co-transfection. Merge images (yellow) show colocalization of AcGFP (green) and DsRed (red). Projection images of the colocalization (gray) were from merge images and shown in the far-right column of each row. The inset scatterplots indicated the extent of colocalization within projection images. Higher Pearson correlation coefficient (r) indicated more colocalization ratio. C Colocalization of YULINK and endosome markers (Clathrin or RHOB). The HEK-293 T cells co-expressing AcGFP-YULINK and mKate-Clathrin, or AcGFP-YULINK and DsRed-RHOB, respectively. Scale bars indicate 4 μm |
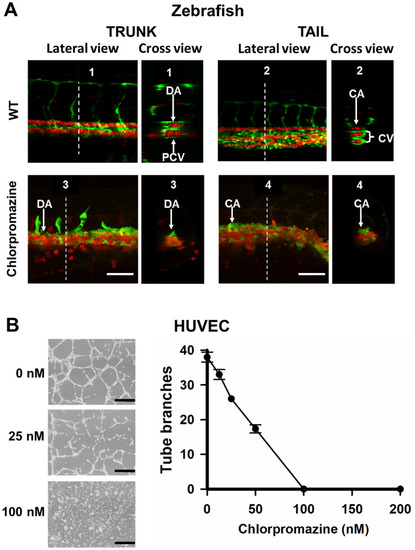
Effects of an endocytosis inhibitor on vein morphogenesis in vivo and capillary tube formation in vitro. A The double Tg (fli1:EGFP; gata1:DsRed) embryos were treated with endocytosis inhibitor, chlorpromazine (60 nM), at 16 hpf. Chlorpromazine was removed at 22 hpf. The lateral and cross-section views of blood vessels in trunk and tail of the Tg (fli1:EGFP; gata1:DsRed) embryos at 24 hpf were shown. White dotted lines indicate the position where the cross-sections are taken. The upper panels were shown as WT groups. DA dorsal aorta, PCV posterior cardinal vein, CA caudal artery, CV caudal vein. Scale bars indicate 50 μm. B Chlorpromazine-mediated inhibition of capillary tube formation in vitro. HUVECs were pretreated with different concentrations of chlorpromazine for 1 h and then seeded in 12-well plates coated with Matrigel. Representative areas are photographed at 10× magnification. Black scale bars indicate 400 μm. Data points represent mean ± SD of two replicate experiments with 4 measurements per treatment PHENOTYPE:
|
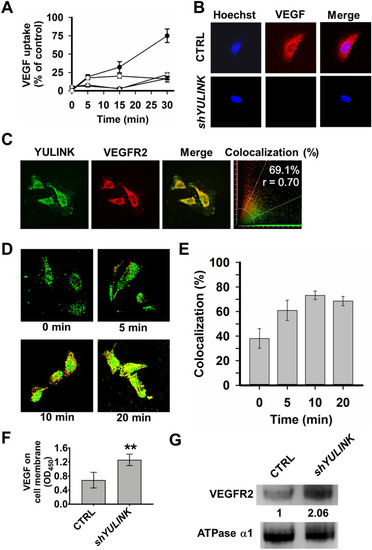
YULINK mediates VEGF internalization and VEGFR2 trafficking in HUVECs. A, B CTRL- and YULINK-knockdown HUVECs were incubated with VEGF-biotin and anti-VEGF blocking antibody pretreated with VEGF-biotin for the indicated times (5, 15, and 30 min). Cells were then fixed and stained with Alexa-Fluor-594-conjugated streptavidin for analysis by confocal microscopy. A Quantified VEGF intensity in cells at various time points. The average intensity of the VEGF signal per cell was calculated from at least twenty cells for each group. ●, CTRL. ○, shYULINK. ▲, CTRL with anti-VEGF blocking antibody. △, shYULINK with anti-VEGF blocking antibody. B Confocal fluorescence images of internalized VEGF in vector control (upper row) and YULINK-knockdown cells (lower row) at 30 min. Hoechst, cell nucleus staining. C HUVECs were stained for YULINK (green) or VEGFR2 (red). Overlay images demonstrate colocalization of green and red-stained molecules by a shift towards yellow in a Leica confocal system. The percentage of colocalizing pixels was shown in the far right column. Colocalization rate and Pearson correlation coefficient (r) were determined for pixel intensity correlation between the red and green channels. The data reveal a high percentage of colocalizing pixels for YULINK/VEGFR2. D VEGFR2 internalization was characterized in serum-starved HUVECs with VEGF treatment for the indicated times, before being fixed, permeabilized, labeled with anti-YULINK (green) and anti-VEGFR2 (red) antibodies, and visualized using fluorescent microscopy. E Quantification of VEGFR2/YULINK colocalization ratios were analyzed at each time point from panel D (mean ± SD). Data points represent mean ± SD of two replicate experiments with 25 measurements per timepoint. F HUVECs treated with shRNA against YULINK or vector control (CTRL) were incubated with VEGF-biotin for 30 min. Then HRP-conjugated streptavidin and TMB were added and OD450 value was measured. G The amount of VEGFR2 at the membrane fraction in the lysate of HUVECs which were treated with shRNA against YULINK or vector control (CTRL) was shown in western blot. Na+/K+ ATPase a1 was used as an internal control |
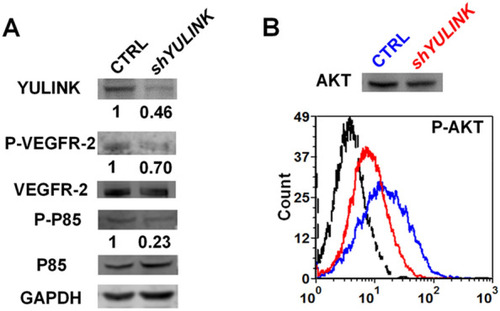
YULINK-knockdown dampens PI3K signaling pathway downstream of VEGFR2. A Western blots of total cell lysates isolated from YULINK-knockdown and vector control HUVECs. Phosphorylation (indicating activation) of VEGFR2 and PI3K subunit P85 was analyzed, with VEGFR2 and PI3K subunit P85 serving as the respective internal controls. GAPDH was detected as a loading control. Band intensities were quantified using the ImageQuant TL software (GE Healthcare), normalized relative to the quantity of their respective control, and expressed as percentages of the value. B Phosflow analysis of phosphor-AKT (Ser473) levels in YULINK-knockdown (red) and vector control (blue) HUVECs. An average of 3,000 gated events was collected on a Canto flow cytometer. Data were analyzed using DIVA software. The dashed profile indicates background staining with a control IgG mAb. Total AKT served as the internal control |

ZFIN is incorporating published figure images and captions as part of an ongoing project. Figures from some publications have not yet been curated, or are not available for display because of copyright restrictions. |