
Fig. 4
- ID
- ZDB-FIG-230728-21
- Publication
- Lin et al., 2023 - YULINK regulates vascular formation in zebrafish and HUVECs
- Other Figures
- All Figure Page
- Back to All Figure Page
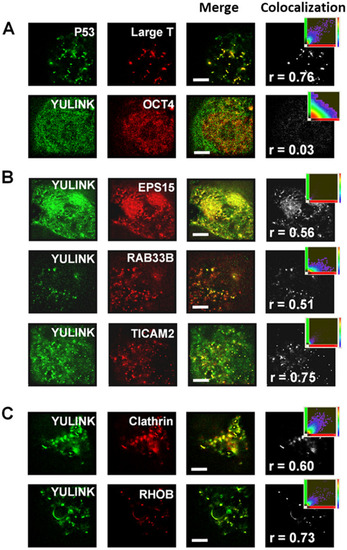
Analysis of colocalization using super-resolution microscopy. A, B The HEK-293 T cells co-expressing AcGFP-YULINK (green) and DsRed conjugates of the proteins of interest (red) were analyzed for colocalization ratio using super-resolution microscopy at 2 days after co-transfection. Merge images (yellow) show colocalization of AcGFP (green) and DsRed (red). Projection images of the colocalization (gray) were from merge images and shown in the far-right column of each row. The inset scatterplots indicated the extent of colocalization within projection images. Higher Pearson correlation coefficient (r) indicated more colocalization ratio. C Colocalization of YULINK and endosome markers (Clathrin or RHOB). The HEK-293 T cells co-expressing AcGFP-YULINK and mKate-Clathrin, or AcGFP-YULINK and DsRed-RHOB, respectively. Scale bars indicate 4 μm |