
- Title
-
c-Kit Receptor Maintains Sensory Axon Innervation of the Skin through Src Family Kinases
- Authors
- Tuttle, A.M., Pomaville, M.B., Delgado, K.C., Wright, K.M., Nechiporuk, A.V.
- Source
- Full text @ J. Neurosci.
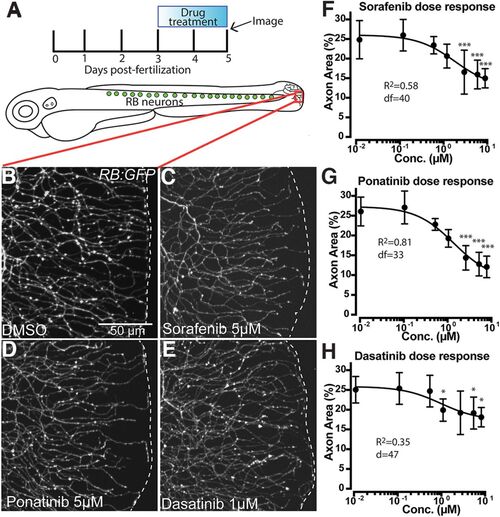
Treatment with MKIs induces loss of cutaneous axon density in zebrafish caudal tail. A, Diagram of RB neurons, drug treatment and imaging paradigm, and imaging location (red box). B–E, Live images of somatosensory axons at the caudal tail tip labeled by RB:GFP after 48 h of treatment. Several MKIs produced significant loss of cutaneous axon density (white dashes indicate tail edge). F–H, Dose-dependent loss of distal axon density induced by (F) sorafenib, (G) ponatinib, and (H) dasatinib treatment, analyzed by one way ANOVA with post hoc Dunnett's test versus the lowest dose. Error bars represent SEM; *p < 0.05, ***p < 0.001. |
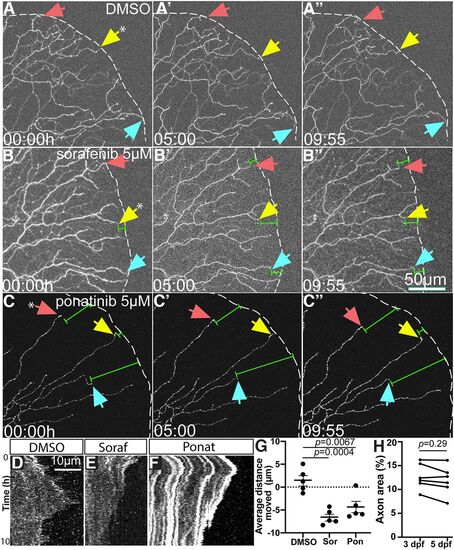
Time lapse imaging reveals axon terminal retraction following sorafenib and ponatinib treatment. A–C, Stills from Movies 1, 2, 3, respectively, of distal axons of sparsely labeled RB neurons. Over 10 h, sorafenib and ponatinib treatment induced retraction of distal axon tips (white dashes = tail edge, arrows indicate specific axon terminals followed over time, green measurement bars indicate distance from edge). D–F, Kymographs of individual axon terminals (indicated by asterisk in panels A–C from respective movies. DMSO terminals (D) show dynamic extension and retraction, but sorafenib (E) or ponatinib (F) treatment induce notable net retraction of axon terminals. G, Quantification of axon retraction in 10-h time lapse movies. Compared with DMSO-treated larvae that had a net increase in axon outgrowth, sorafenib and ponatinib treatment induced a significant net retraction of distal RB axon terminals in labeled neurons by one-way ANOVA with post hoc Dunnett's test. Error bars represent SEM. H, Repeated measures of axonal density of WT control larval tails analyzed by paired t test from 3 to 5 dpf had no difference: 3 dpf = 12.3 ± 1.1% axon area, 5 dpf = 11.9 ± 1.2. |
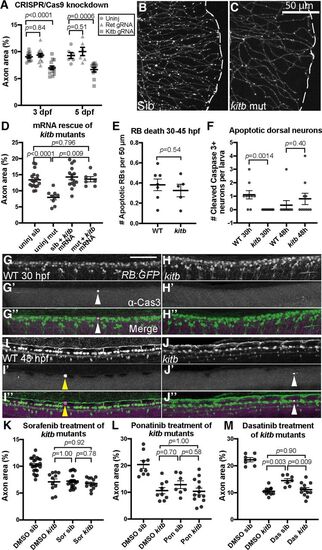
kitb is a major target mediating cutaneous axonal effects of several MKIs. A, Quantification of distal cutaneous axon density in caudal tail after CRISPR-Cas9-mediated knock-down of either ret or kitb; 3 dpf: uninjected = 9.1 ± 0.3% area, ret gRNA= 9.3 ± 0.3, kitb gRNA = 7.0 ± 0.3; 5 dpf: uninjected = 9.3 ± 0.5%, ret gRNA= 10.3 ± 0.9, kitb gRNA = 6.7 ± 0.4. B, C, Live imaging at 5 dpf of kitb homozygous mutants or siblings (sib) in the RB:GFP transgenic background (white dashes = tail edge). D, Expression of kitb mRNA suppresses kitb mutant axon density defect. Uninjected sib = 13.4 ± 0.6% area, uninjected mutant = 7.9 ± 0.7, kitb mRNA sib = 14.9 ± 0.9, kitb mRNA mutant = 13.6 ± 0.8. E, Quantification of time-lapse observation of RB cell death during embryonic development, analyzed with unpaired t test. Error bars represent SEM. There was no significant difference in the number of RB neurons undergoing apoptosis between kitb mutants and siblings. F, Quantification of Cleaved-Caspase-3+ dorsal neurons in immunostained RB:GFP WT and kitb mutant larvae, analyzed by unpaired Student's t test at each time point. There was no significant difference in GFP+/cleaved-Caspase-3+ dorsal neuron number in kitb mutants at 48 hpf compared with siblings but at 30 hpf, there were significantly fewer of these cells detected in kitb mutants. G–J, Images of cleaved-Caspase-3 immunostaining in dorsal trunks of fixed RB:GFP larvae at 30 hpf (G, H) and 48 hpf (I, J). Scale bar: 100 μm; white arrowheads=cleaved-Caspase-3+ dorsal neurons, yellow arrow heads = cleaved-Caspase-3+ non-neurons. K–M, Quantification of kitb mutants treated with either sorafenib (K), ponatinib (L), or dasatinib (M) using the same treatment paradigm from Figure 1A. While treatment with either drug or genetic loss of kitb induced loss of cutaneous axon density, treatment of kitb mutants with drug did not exacerbate this phenotype, indicating Kitb is a major target underlying their peripheral neurotoxicity in this case. Two-way ANOVA with post hoc Tukey's HSD test for datasets. K, DMSO sib = 10.2 ± 0.3% area versus DMSO kitb = 7.1 ± 0.5, p < 0.0001; versus sorafenib sib = 7.2 ± 0.3, p < 0.0001; versus sorafenib kitb = 6.8 ± 0.3, p < 0.0001. L, DMSO sib = 20.4 ± 1.5% area versus DMSO kitb = 10.6 ± 1.2, p < 0.0001; versus ponatinib sib = 12.9 ± 1.4, p = 0.0051; versus ponatinib kitb = 10.4 ± 1.2, p < 0.0001. M, DMSO WT = 22.2 ± 0.8% versus DMSO kitb = 10.5 ± 0.5, p < 0.0001; versus dasatinib WT = 14.5 ± 0.7, p < 0.0001; versus dasatinib kitb = 11.1 ± 0.7, p < 0.0001. Error bars represent SEM. |
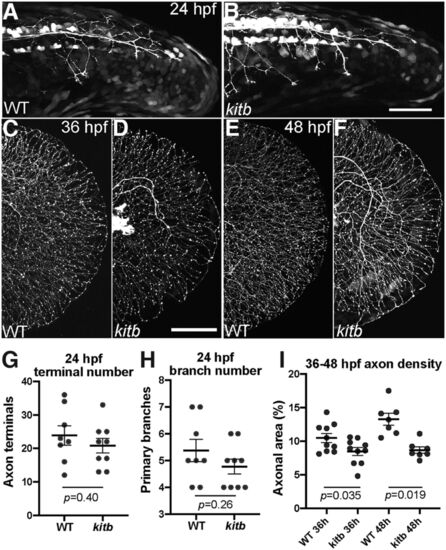
Kitb mutants exhibit reduced axon density following normal initial extension. A–F, Live lateral images of RB:GFP tail regions from 24 to 48 hpf. Scale bar: 50 μm. A, B, WT and kitb mutants exhibit similar RB axon extension and early branching in distal tail at 24 hpf. C–F, WT and kitb mutant RB axons fully extend to the distal caudal tail and grow along the perimeter by 36 and 48 hpf; however, kitb mutants have reduced distal axonal density by 36 hpf and beyond. Scale bar: 50 μm. G, H, Quantification of RB axon terminal number and primary branch number at 24 hpf in the distal 200 μm of the tail. There was no significant difference between WT and kitb mutants in distal terminal number (G) or branch number (H), indicating axon growth and extension were normal. I, Quantification of distal axonal density at 36 and 48 hpf: kitb mutants had significantly reduced axonal density of the distal caudal tail compared with WT. Error bars represent SEM |
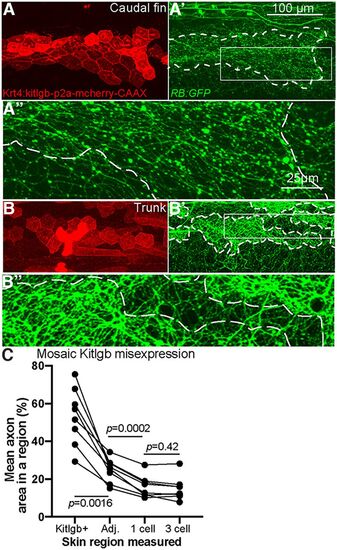
Overexpression of Kit ligand b increases local axon density. A, B, Live imaging at 4 dpf of larvae injected with plasmid expressing kitlgb under a skin promoter. A', B', RB axons, labeled by RB:GFP, are significantly denser in regions of skin cells overexpressing kitlgb (white dashes indicate Kitlgb/mCherry+ regions). A”, B”, 4× magnified insets of A', B'. C, Quantification of axon density within individual larvae mosaically expressing Kitlgb (repeated measures ANOVA). Comparison of average axonal area within Kitlgb/mCherry+ regions (Kitlgb+), directly adjacent regions (Adj.), 1 cell length distance or 3 skin cell length distance from mCherry+ skin cells. Kitlgb+ = 53.2 ± 5.4% axonal area, Kitlgb–adjacent region =24.8 ± 2.2, 1 cell length distance = 16.0 ± 2.0, 3 cell length distance =15 ± 2.2. Kitlgb-misexpressing regions had significantly higher axonal density than any other region, while directly adjacent regions also had higher density than regions further away |
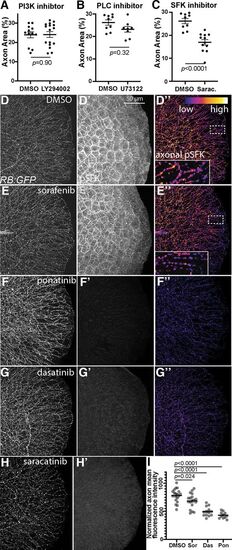
MKI treatment reduces axonal SFK activity. A–C, Quantification of treatment of larvae treated with 25 μm LY294002, 0.75 μm PLC inhibitor U73122, or 30 μm saracatinib. Treatment with LY294002 or U73122 had no significant effect on axonal area but saracatinib did. Analyzed by unpaired t test. A, DMSO = 26.1 ± 1.2% area, U73122 = 23.1 ± 1.3. B, DMSO = 25.2 ± 1.9% area, LY294002 = 25.2 ± 1.8. C, DMSO = 26.2 ± 1.2% area, saracatinib = 17 ± 1.2. D–H, Lateral view of fixed tails from RB:GFP larvae treated with DMSO, sorafenib, ponatinib, dasatinib, or saracatinib for 7 h at 3 dpf. D'–H', Tail tissue pSFK immunostaining. D”–G”, Axonal-only pSFK staining for DMSO-treated, sorafenib-treated, ponatinib-treated, and dasatinib-treated larvae. Sorafenib reduced axonal pSFK staining but did not notably affect other pSFK staining. Ponatinib, dasatinib, and saracatinib abolish nearly all pSFK staining throughout the tail tissue. Dashed white lines denote regions included in 4× inset. I, Quantification of axonal pSFK staining following acute drug treatment, analyzed by one-way ANOVA with post hoc Dunnett's test versus DMSO controls. DMSO = 782 ± 27 A.U., sorafenib = 685 ± 31, ponatinib = 495 ± 23, dasatinib = 433 ± 17. Error bars represent SEM. |
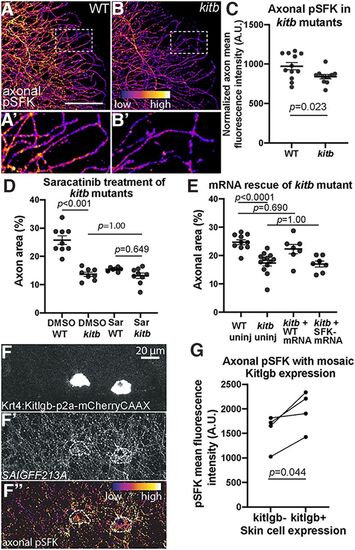
SFK activity regulates axon density downstream of Kitb. A, B, Axonal-only pSFK immunostaining for WT (A) and kitb (B) mutant 3 dpf larval tails. White dotted lines indicate regions of insets (A', B') at 3× magnification. Scale bar: 50 μm. C, Quantification of pSFK immunostaining intensity in distal larval tail axons. Kitb mutants have significantly reduced pSFK staining intensity compared with WT; WT = 920.0 ± 36.1 A.U. versus kitb mutant = 776.6 ± 36.6. D, Quantification of saracatinib treatment of kitb mutants, analyzed by two-way ANOVA with post hoc Tukey's HSD test. DMSO WT = 25.8 ± 1.5%area, DMSO kitb = 13.7 ± 0.7, saracatinib WT = 15.4 ± 0.3, saracatinib kitb = 13.2 ± 0.9. E, Quantification of axon density of kitb mutants injected with WT or kitbY568F,Y570F mRNA (“SFK–”), analyzed by two-way ANOVA with post hoc Tukey's HSD test. WT uninjected = 24.7 ± 0.9% area, kitb mutant uninjected = 17.3 ± 1, kitb mutant + WT kitb mRNA = 22.3 ± 1.6, kitb mutant + Y568F/Y570F kitb mRNA (“kitb + SFK- mRNA”) = 17.0 ± 1.1. F–F”, Example of Krt4:Kitlgb-p2a-mCherryCAAX-injected 3 dpf larvae immunostained for pSFK. Axonal density and pSFK staining are increased in regions near Kitlgb expression (white dashes). G, Quantification of mean axonal pSFK intensity in Kitlgb+ versus Kitlgb– regions within 3 dpf larvae, analyzed by paired t test. Error bars represent SEM. |
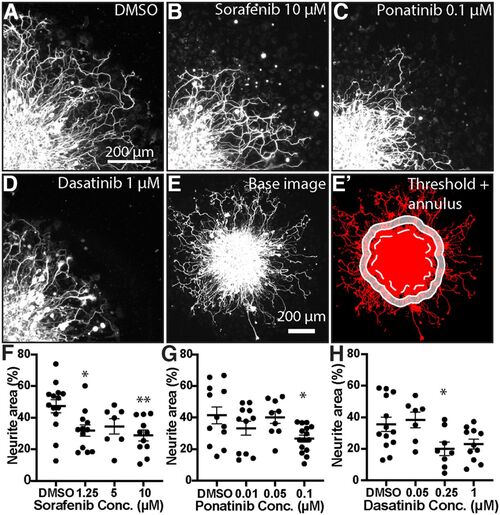
MKI treatment induces loss of neurite density in mammalian DRGs. A–D, Single quadrant images of fixed DRG explants immunostained for βIII-Tubulin treated with vehicle or MKI compounds. MKI treatment led to shorter and less dense neurites. E, E', Demonstration of neurite area analysis. Immunostained DRG explants were imaged (E), thresholded (E', red), and then the explant core was identified (dotted white line) and a 50-μm-thick annulus (white shaded area) was created by drawing the inner and outer perimeter 50 and 100 μm from the edge of the explant core, respectively. F-H, Quantification of neurite area, analyzed by one-way ANOVA with post hoc Dunnett's test. F, Sorafenib: DMSO = 47.3 ± 4.2% area, 1.25 μm 32.0 ± 3.6, p = 0.016, 5 μm 34.5 ± 4.8, p = 0.116, 10 μm 28.8 ± 3.4, p = 0.0039. G, Ponatinib: DMSO = 41.4 ± 5.3, 0.01 μm 33.3 ± 4.4, p = 0.353, 0.05 μm 40.1 ± 3.9, p = 0.99, 1 μm 26.8 ± 2.2 p = 0.0215. H, Dasatinib: DMSO = 35.6 ± 4.5, 0.05 μm 38.4 ± 4.9, p = 0.954, 0.25 μm 20.0 ± 4.3, p = 0.038, 1 μm 23.0 ± 3.1, p = 0.073. Error bars represent SEM; *p < 0.05, **p < 0.01. |