
|
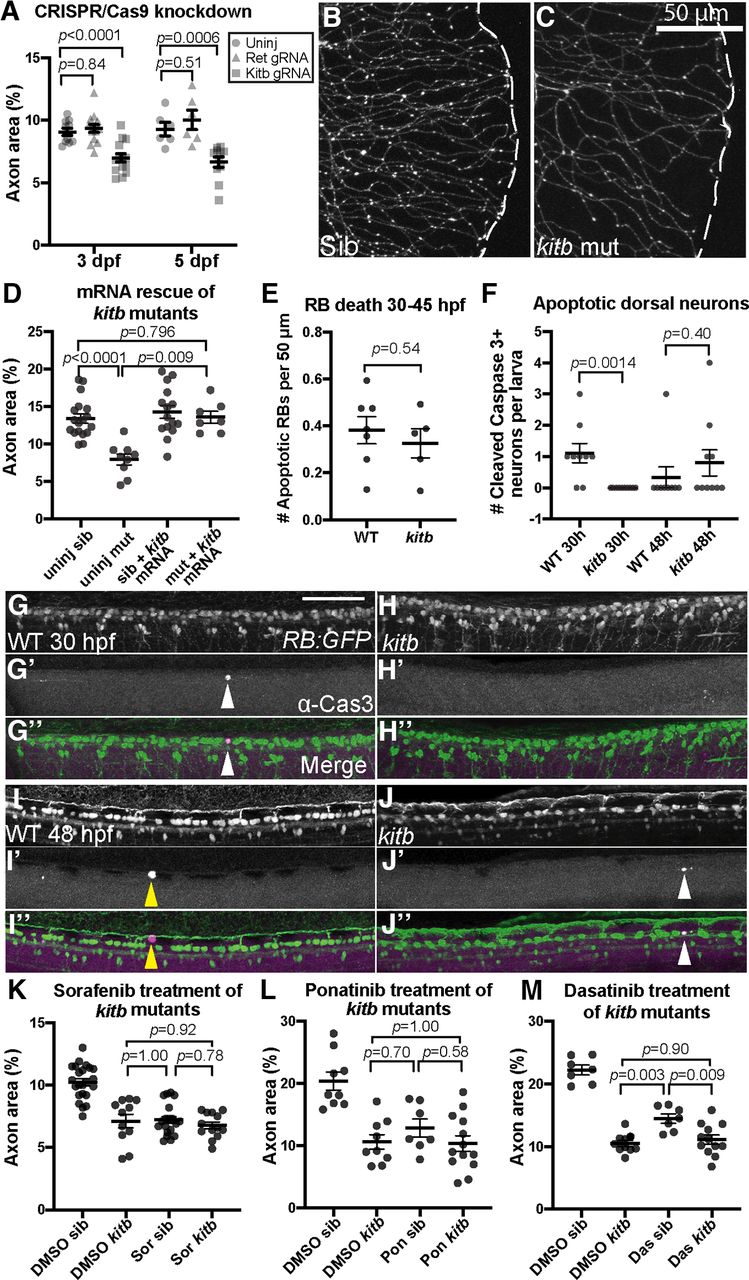
Fig. 3 kitb is a major target mediating cutaneous axonal effects of several MKIs. A, Quantification of distal cutaneous axon density in caudal tail after CRISPR-Cas9-mediated knock-down of either ret or kitb; 3 dpf: uninjected = 9.1 ± 0.3% area, ret gRNA= 9.3 ± 0.3, kitb gRNA = 7.0 ± 0.3; 5 dpf: uninjected = 9.3 ± 0.5%, ret gRNA= 10.3 ± 0.9, kitb gRNA = 6.7 ± 0.4. B, C, Live imaging at 5 dpf of kitb homozygous mutants or siblings (sib) in the RB:GFP transgenic background (white dashes = tail edge). D, Expression of kitb mRNA suppresses kitb mutant axon density defect. Uninjected sib = 13.4 ± 0.6% area, uninjected mutant = 7.9 ± 0.7, kitb mRNA sib = 14.9 ± 0.9, kitb mRNA mutant = 13.6 ± 0.8. E, Quantification of time-lapse observation of RB cell death during embryonic development, analyzed with unpaired t test. Error bars represent SEM. There was no significant difference in the number of RB neurons undergoing apoptosis between kitb mutants and siblings. F, Quantification of Cleaved-Caspase-3+ dorsal neurons in immunostained RB:GFP WT and kitb mutant larvae, analyzed by unpaired Student's t test at each time point. There was no significant difference in GFP+/cleaved-Caspase-3+ dorsal neuron number in kitb mutants at 48 hpf compared with siblings but at 30 hpf, there were significantly fewer of these cells detected in kitb mutants. G–J, Images of cleaved-Caspase-3 immunostaining in dorsal trunks of fixed RB:GFP larvae at 30 hpf (G, H) and 48 hpf (I, J). Scale bar: 100 μm; white arrowheads=cleaved-Caspase-3+ dorsal neurons, yellow arrow heads = cleaved-Caspase-3+ non-neurons. K–M, Quantification of kitb mutants treated with either sorafenib (K), ponatinib (L), or dasatinib (M) using the same treatment paradigm from Figure 1A. While treatment with either drug or genetic loss of kitb induced loss of cutaneous axon density, treatment of kitb mutants with drug did not exacerbate this phenotype, indicating Kitb is a major target underlying their peripheral neurotoxicity in this case. Two-way ANOVA with post hoc Tukey's HSD test for datasets. K, DMSO sib = 10.2 ± 0.3% area versus DMSO kitb = 7.1 ± 0.5, p < 0.0001; versus sorafenib sib = 7.2 ± 0.3, p < 0.0001; versus sorafenib kitb = 6.8 ± 0.3, p < 0.0001. L, DMSO sib = 20.4 ± 1.5% area versus DMSO kitb = 10.6 ± 1.2, p < 0.0001; versus ponatinib sib = 12.9 ± 1.4, p = 0.0051; versus ponatinib kitb = 10.4 ± 1.2, p < 0.0001. M, DMSO WT = 22.2 ± 0.8% versus DMSO kitb = 10.5 ± 0.5, p < 0.0001; versus dasatinib WT = 14.5 ± 0.7, p < 0.0001; versus dasatinib kitb = 11.1 ± 0.7, p < 0.0001. Error bars represent SEM.