
|
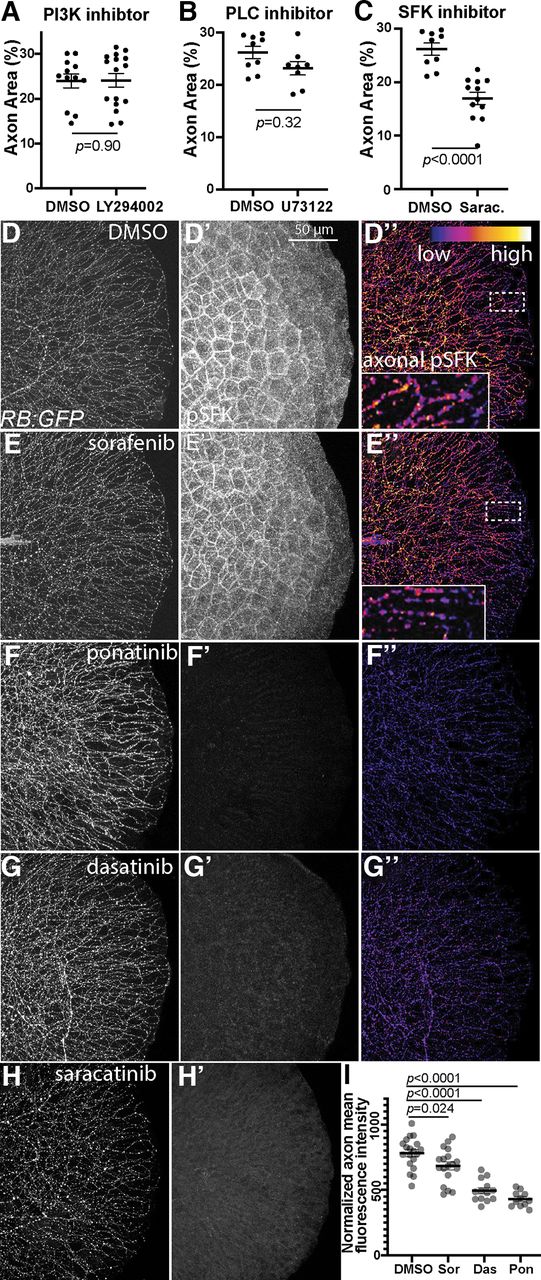
Fig. 6 MKI treatment reduces axonal SFK activity. A–C, Quantification of treatment of larvae treated with 25 μm LY294002, 0.75 μm PLC inhibitor U73122, or 30 μm saracatinib. Treatment with LY294002 or U73122 had no significant effect on axonal area but saracatinib did. Analyzed by unpaired t test. A, DMSO = 26.1 ± 1.2% area, U73122 = 23.1 ± 1.3. B, DMSO = 25.2 ± 1.9% area, LY294002 = 25.2 ± 1.8. C, DMSO = 26.2 ± 1.2% area, saracatinib = 17 ± 1.2. D–H, Lateral view of fixed tails from RB:GFP larvae treated with DMSO, sorafenib, ponatinib, dasatinib, or saracatinib for 7 h at 3 dpf. D'–H', Tail tissue pSFK immunostaining. D”–G”, Axonal-only pSFK staining for DMSO-treated, sorafenib-treated, ponatinib-treated, and dasatinib-treated larvae. Sorafenib reduced axonal pSFK staining but did not notably affect other pSFK staining. Ponatinib, dasatinib, and saracatinib abolish nearly all pSFK staining throughout the tail tissue. Dashed white lines denote regions included in 4× inset. I, Quantification of axonal pSFK staining following acute drug treatment, analyzed by one-way ANOVA with post hoc Dunnett's test versus DMSO controls. DMSO = 782 ± 27 A.U., sorafenib = 685 ± 31, ponatinib = 495 ± 23, dasatinib = 433 ± 17. Error bars represent SEM.