
Fig. 7
- ID
- ZDB-FIG-240702-215
- Publication
- Tuttle et al., 2022 - c-Kit Receptor Maintains Sensory Axon Innervation of the Skin through Src Family Kinases
- Other Figures
- All Figure Page
- Back to All Figure Page
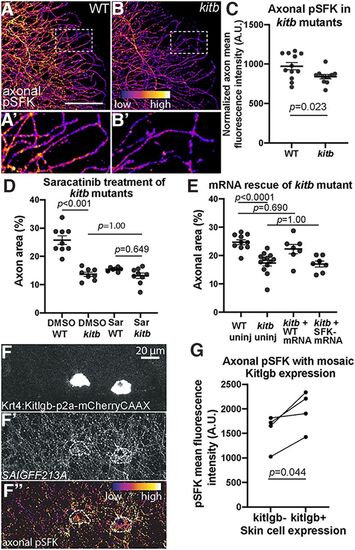
SFK activity regulates axon density downstream of Kitb. A, B, Axonal-only pSFK immunostaining for WT (A) and kitb (B) mutant 3 dpf larval tails. White dotted lines indicate regions of insets (A', B') at 3× magnification. Scale bar: 50 μm. C, Quantification of pSFK immunostaining intensity in distal larval tail axons. Kitb mutants have significantly reduced pSFK staining intensity compared with WT; WT = 920.0 ± 36.1 A.U. versus kitb mutant = 776.6 ± 36.6. D, Quantification of saracatinib treatment of kitb mutants, analyzed by two-way ANOVA with post hoc Tukey's HSD test. DMSO WT = 25.8 ± 1.5%area, DMSO kitb = 13.7 ± 0.7, saracatinib WT = 15.4 ± 0.3, saracatinib kitb = 13.2 ± 0.9. E, Quantification of axon density of kitb mutants injected with WT or kitbY568F,Y570F mRNA (“SFK–”), analyzed by two-way ANOVA with post hoc Tukey's HSD test. WT uninjected = 24.7 ± 0.9% area, kitb mutant uninjected = 17.3 ± 1, kitb mutant + WT kitb mRNA = 22.3 ± 1.6, kitb mutant + Y568F/Y570F kitb mRNA (“kitb + SFK- mRNA”) = 17.0 ± 1.1. F–F”, Example of Krt4:Kitlgb-p2a-mCherryCAAX-injected 3 dpf larvae immunostained for pSFK. Axonal density and pSFK staining are increased in regions near Kitlgb expression (white dashes). G, Quantification of mean axonal pSFK intensity in Kitlgb+ versus Kitlgb– regions within 3 dpf larvae, analyzed by paired t test. Error bars represent SEM. |