
|
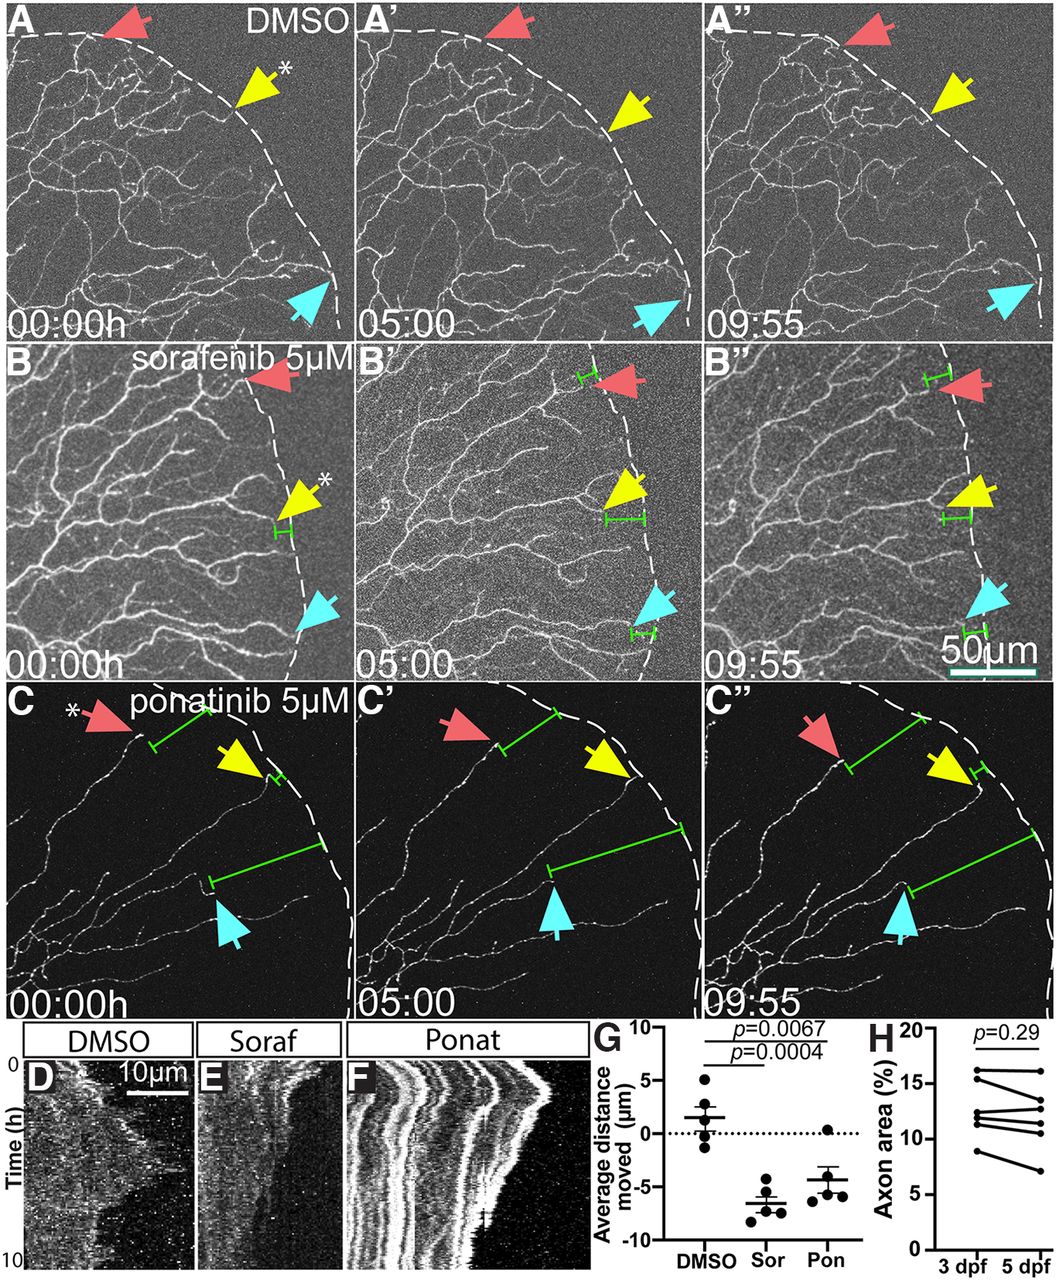
Fig. 2 Time lapse imaging reveals axon terminal retraction following sorafenib and ponatinib treatment. A–C, Stills from Movies 1, 2, 3, respectively, of distal axons of sparsely labeled RB neurons. Over 10 h, sorafenib and ponatinib treatment induced retraction of distal axon tips (white dashes = tail edge, arrows indicate specific axon terminals followed over time, green measurement bars indicate distance from edge). D–F, Kymographs of individual axon terminals (indicated by asterisk in panels A–C from respective movies. DMSO terminals (D) show dynamic extension and retraction, but sorafenib (E) or ponatinib (F) treatment induce notable net retraction of axon terminals. G, Quantification of axon retraction in 10-h time lapse movies. Compared with DMSO-treated larvae that had a net increase in axon outgrowth, sorafenib and ponatinib treatment induced a significant net retraction of distal RB axon terminals in labeled neurons by one-way ANOVA with post hoc Dunnett's test. Error bars represent SEM. H, Repeated measures of axonal density of WT control larval tails analyzed by paired t test from 3 to 5 dpf had no difference: 3 dpf = 12.3 ± 1.1% axon area, 5 dpf = 11.9 ± 1.2.