
- Title
-
Interleukin-10 regulates goblet cell numbers through Notch signaling in the developing zebrafish intestine
- Authors
- Morales, R.A., Rabahi, S., Diaz, O.E., Salloum, Y., Kern, B.C., Westling, M., Luo, X., Parigi, S.M., Monasterio, G., Das, S., Hernández, P.P., Villablanca, E.J.
- Source
- Full text @ Mucosal Immunol
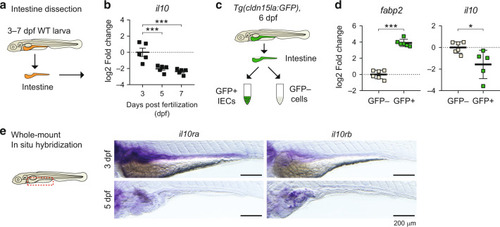
Early expression of il10 during intestinal development in zebrafish larvae.
a Diagram showing intestine extractions of wild-type (WT) larvae, from 3 to 7 days post fertilization (dpf). b Expression of il10 transcripts measured by qRT-PCR. Each dot represents independent experiments with a pool of 20 intestines used for RNA extraction (N = 5). c Sorting strategy for the isolation of intestinal epithelial cells. Intestines from Tg(cldn15la:GFP) larvae were extracted from the body, disaggregated to cell suspensions, and FACS sorted based on the expression of GFP. GFP+ and GFP- cell collections were subsequently used for RNA transcriptomic analyses. d Transcriptomic expression analyses from sorted GFP+ and GFP- cells by qRT-PCR. Each dot represents an individual sorting experiment with around 30,000 cells collected (N = 6). e Whole-mount in situ hybridization for the genes il10ra and il10rb in 3dpf and 5dpf zebrafish larvae. Representative pictures of the stainings at each developmental stage are shown. Scale bar = 200 µm. One-way ANOVA with Fisher’s LSD multiple comparisons test was performed in b, while two-tailed t-tests were performed in d (*p < 0.05; ***p < 0.001). EXPRESSION / LABELING:
|
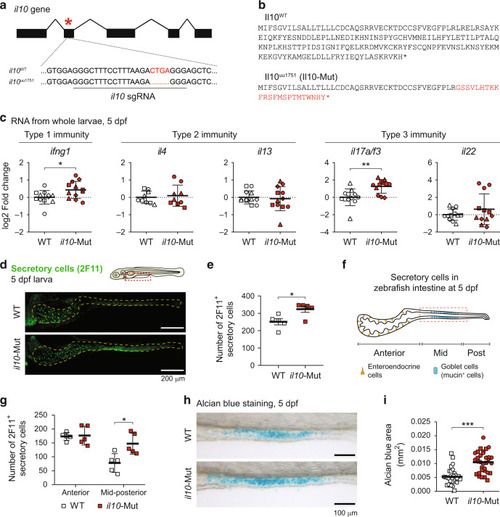
Increased pro-inflammatory expression and alcian blue+ goblet cells in il10 mutant zebrafish larvae.
a Schematic for the mutation generated in the zebrafish il10 gene (il10uu1751, -4bp) by CRISPR/Cas9. b Predicted protein sequences for Il10 in WT and il10-Mut individuals, according to the DNA sequences obtained. c Whole-body expression levels of type 1, type 2, and type 3 cytokines in WT (white symbols) and il10-Mut larvae (red symbols) by qRT-PCR. Each dot represents a pool of 5–10 larvae collected in 3–4 independent experiments. d Whole-mount immunofluorescence staining in 5dpf WT and il10-Mut larvae using the pan-secretory marker antibody 2F11. Scale bar = 100 µm. e Quantification of 2F11+ cells in the intestines of WT and il10-Mut larvae. Each dot represents individual larvae collected in 2 independent experiments. f Diagram for the larval zebrafish intestinal tract showing the location of Goblet cells in the mid-intestinal region. g Stratification of the number of 2F11+ cells in the anterior or mid-posterior intestines of WT and il10-Mut larvae (N = 5). h Alcian blue (ab) staining on 5dpf WT and il10-Mut larvae. i Automatic quantifications of the ab-stained area in the mid intestines of WT and il10-Mut larvae. Each dot corresponds to an individual larva collected in two independent experiments. Different symbol shapes represent independent experiments in c and i. Two-tailed student t tests were used for the comparisons in c, e, g and i. (*p < 0.05; **p < 0.01; ***p < 0.001). |
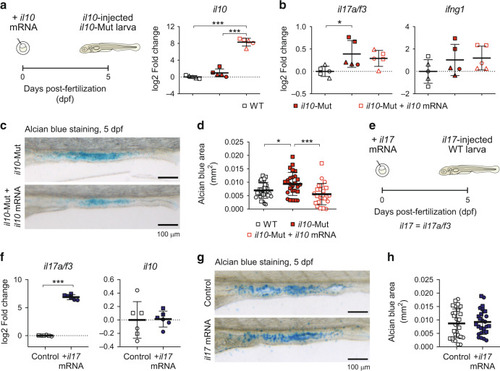
Altered alcian blue+ goblet cell homeostasis in il10 mutant larvae is rescued after il10 mRNA administration.
a Experimental strategy for il10 rescue experiments and expression levels of il10 mRNA at 5dpf. b Whole-body expression levels of il17a/f3 and ifng1 by qRT-PCR. Each dot represents a pool of 5–10 larvae collected in three independent experiments. c Alcian blue stainings on 5dpf WT, il10-Mut larva controls and injected with il10 mRNA. Scale bar = 100 µm. d Quantification for the ab-stained area in the il10 mRNA-injected il10-KO larvae, compared to control il10-KO and WT larvae. N = 2 independent experiments. e Experimental strategy for the injection and analysis of il17 (il17a/f3) mRNA-injected WT zebrafish embryos. f Whole-body expression levels of il17a/f3 and il10 by qPCR. Dots represent pools of 5–10 larvae collected in 2 independent experiments. g Alcian blue stainings on 5dpf control and il17-injected WT larvae. Scale bar = 100 µm. h Quantification of the ab-stained area of control and il17-injected larvae. N = 2 independent experiments. Each independent experiment is shown with a different symbol shape in a, b, d, f and h. One-way ANOVA was used for statistical analysis in a, b and d, whereas two-tailed student t-test were used in f and h (*p < 0.05; ***p < 0.001). |
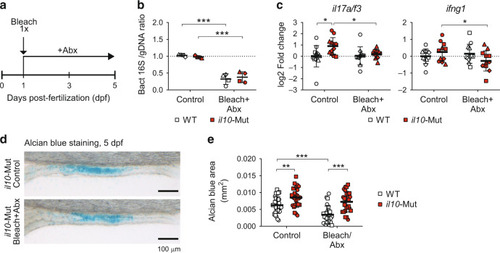
Increased alcian blue+ goblet cells in il10 mutant larvae are independent of the microbiota.
a Diagram showing bleach (sodium hypochlorite 0.004%) plus antibiotic (Abx) treatment in zebrafish embryos/larvae (Abx: Ampicillin 100 µg/mL, Kanamycin 5 µg/mL). b Quantification of bacterial 16S DNA levels over zebrafish genomic DNA measured by PCR. Each dot corresponds to a pool of 2 larvae from 4 independent experiments. c Transcriptomic expression analysis of cytokines from treated larvae by qRT-PCR. Each dot represents a pool of 8–10 larvae collected from 4 independent experiments (d, e) Alcian blue staining and analysis on 5dpf WT and il10-Mut larvae treated with Bleach+Abx and controls (N = 2 independent experiments). Scale bar = 100 µm. Independent experiments are shown with different symbol shapes in b, c and e. Two-way ANOVAs with Fisher’s LSD multiple comparisons tests were performed in b, c and e (*p < 0.05; **p < 0.01; ***p < 0.001). |
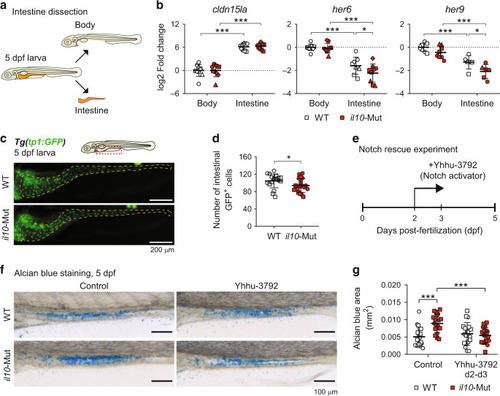
Decreased Notch signaling activity in the intestines of il10 mutant larvae.
a Schematics showing the body-intestine tissue collection for RNA expression analyses. b qRT-PCR for intestinal (cldn15la) and Notch signaling pathway markers (her6 and her9). Each dot represents a pool of 10 separated intestines and body remnants collected from 4 independent experiments. c Representative images of Tg(tp1:GFP) in WT or il10-Mut genetic backgrounds. Scale bar = 200 μm. d Quantification of the number of tp1:GFP+ cells in the intestines of WT or il10-Mut individuals. Each dot corresponds to 1 larva. Two independent experiments were performed. e Schematics for the rescue experiments in which il10-Mut larvae are exposed to the Notch activator Yhhu-3792. f Representative pictures of alcian blue stainings from 5dpf WT and il10-Mut larvae after treatment with Yhhu-3792. Scale bar = 100 μm. g Quantification of the ab-stained area after Yhhu-3792. Each dot represents individual larvae collected from two independent experiments. Independent experiments are shown with different symbol shapes in b, d and g. Two-way ANOVAs with Fisher’s LSD multiple comparisons tests were performed in b and g, while a two-tailed t-test was performed in d (*p < 0.05; ***p < 0.001). |
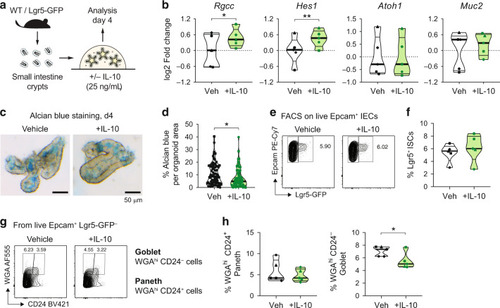
Enhanced Notch signaling and decreased goblet cell frequencies in mouse small intestine organoids treated with IL-10.
a Schematics for mouse SI organoid cultures. Organoids were grown in ENR media (containing EGF, Noggin, and R-Spondin) supplemented with recombinant murine IL-10 or BSA (Vehicle control). b RNA expression analysis by qRT-PCR from organoids treated with IL-10. Each dot represents SI organoids generated from an individual mouse (N = 5 independent mice). c Alcian blue staining of SI organoids in vehicle- and IL-10-treated organoids. Scale bar = 50 µm. d Percentage of the ab-stained area from the total organoid area. Dots represent single organoids imaged from 2 independent experiments/mice. e Flow cytometry analysis of organoids generated from SI crypts of Lgr5-GFP mice. Representative contour plots showing the percentage of intestinal stem cells (Epcam+ Lgr5-GFP+ cells) are shown. f Frequency of Lgr5+ intestinal stem cells (ISCs) after IL-10 treatments. Dots represent pools of organoids collected from 5 different mice. g Representative contour plots of WGA/CD24 stainings on disaggregated organoids treated with IL-10. h Frequencies of goblet cells (Epcam+ Lgr5-GFP- WGAhi CD24-) and paneth cells (Epcam+ Lgr5- WGAhi CD24+) from vehicle and IL-10-treated SI organoids. N = 5 independent mice. Independent experiments are represented by different symbol shapes in b, d, f and h. Conventional two-tailed t-test was performed in d, whereas paired two-tailed t tests were performed in b, f and h (*p < 0.05, **p < 0.01). |