
|
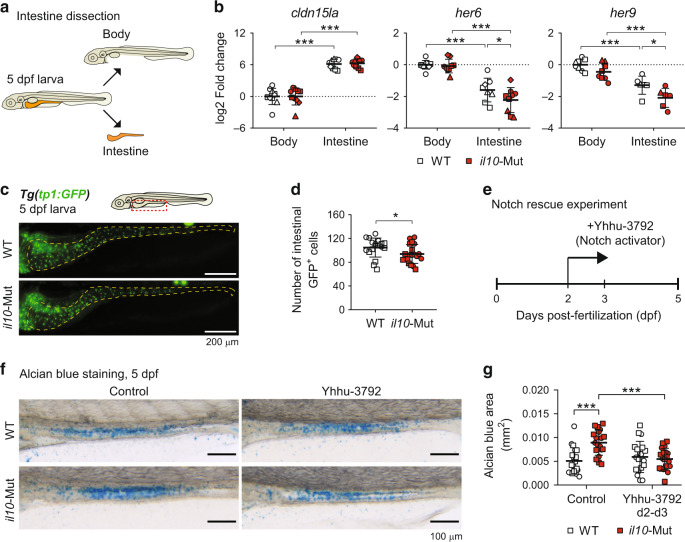
Fig. 5
a Schematics showing the body-intestine tissue collection for RNA expression analyses. b qRT-PCR for intestinal (cldn15la) and Notch signaling pathway markers (her6 and her9). Each dot represents a pool of 10 separated intestines and body remnants collected from 4 independent experiments. c Representative images of Tg(tp1:GFP) in WT or il10-Mut genetic backgrounds. Scale bar = 200 μm. d Quantification of the number of tp1:GFP+ cells in the intestines of WT or il10-Mut individuals. Each dot corresponds to 1 larva. Two independent experiments were performed. e Schematics for the rescue experiments in which il10-Mut larvae are exposed to the Notch activator Yhhu-3792. f Representative pictures of alcian blue stainings from 5dpf WT and il10-Mut larvae after treatment with Yhhu-3792. Scale bar = 100 μm. g Quantification of the ab-stained area after Yhhu-3792. Each dot represents individual larvae collected from two independent experiments. Independent experiments are shown with different symbol shapes in b, d and g. Two-way ANOVAs with Fisher’s LSD multiple comparisons tests were performed in b and g, while a two-tailed t-test was performed in d (*p < 0.05; ***p < 0.001).