
|
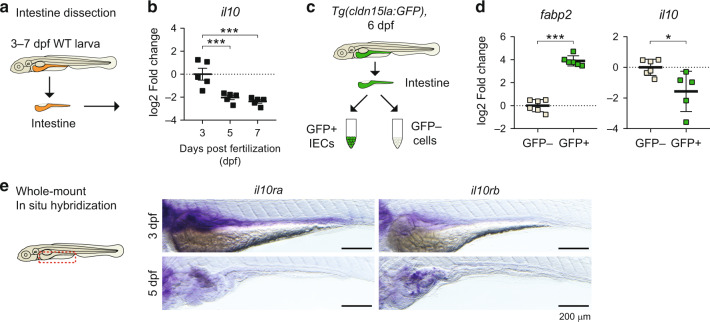
Fig. 1
a Diagram showing intestine extractions of wild-type (WT) larvae, from 3 to 7 days post fertilization (dpf). b Expression of il10 transcripts measured by qRT-PCR. Each dot represents independent experiments with a pool of 20 intestines used for RNA extraction (N = 5). c Sorting strategy for the isolation of intestinal epithelial cells. Intestines from Tg(cldn15la:GFP) larvae were extracted from the body, disaggregated to cell suspensions, and FACS sorted based on the expression of GFP. GFP+ and GFP- cell collections were subsequently used for RNA transcriptomic analyses. d Transcriptomic expression analyses from sorted GFP+ and GFP- cells by qRT-PCR. Each dot represents an individual sorting experiment with around 30,000 cells collected (N = 6). e Whole-mount in situ hybridization for the genes il10ra and il10rb in 3dpf and 5dpf zebrafish larvae. Representative pictures of the stainings at each developmental stage are shown. Scale bar = 200 µm. One-way ANOVA with Fisher’s LSD multiple comparisons test was performed in b, while two-tailed t-tests were performed in d (*p < 0.05; ***p < 0.001).