
- Title
-
α-Ketoglutarate-Mediated DNA Demethylation Sustains T-Acute Lymphoblastic Leukemia upon TCA Cycle Targeting
- Authors
- Wang, Y., Shen, N., Spurlin, G., Korm, S., Huang, S., Anderson, N.M., Huiting, L.N., Liu, H., Feng, H.
- Source
- Full text @ Cancers
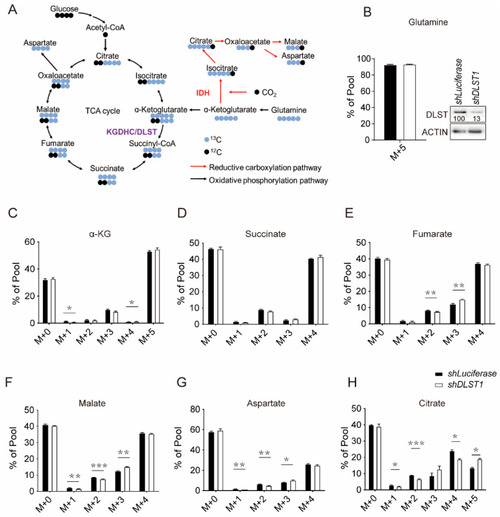
DLST inactivation increased reductive carboxylation while reducing TCA cycle intermediates in human T-ALL cells. (A) Scheme of 13C labeled glutamine contribution to TCA cycle metabolites. (B) Percentage of 13C-labelled glutamine uptake in human MOLT3 cells in the presence or absence of DLST knockdown. The insert in panel (B) shows efficient depletion of DLST by shDLST1 hairpin. (C–H) Percentages of TCA cycle metabolites derived from 13C labeled glutamine in the presence or absence of DLST knockdown. M stands for mass. The labels for M + 0, M + 1, M + 2, M + 3, M + 4, and M + 5 indicate that no or one to five carbons in the metabolite are derived from 13C labeled glutamine. The data are presented as the mean ± s.e.m. and analyzed with an unpaired two-tailed t-test for statistical significance. * p < 0.05, ** p < 0.01, *** p < 0.001. |
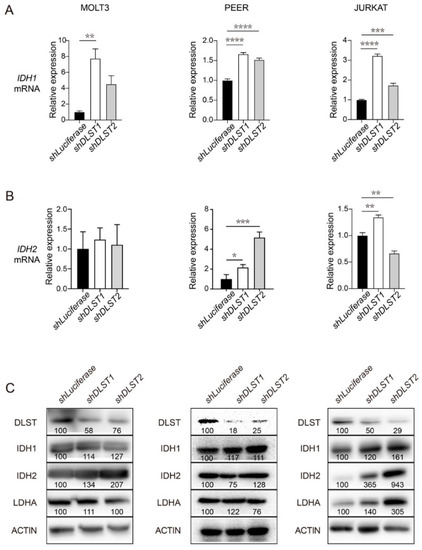
DLST inactivation increases transcript and protein levels of IDH1 and IDH2 in human T-ALL cells. (A,B) qRT-PCR analysis of IDH1 (A) and IDH2 (B) transcript levels at 4 days transduction of shLuciferase and shDLST in human MOLT3, PEER, and JURKAT T-ALL cell lines. Relative fold change was analyzed using the shLuciferase group as a control. The data are presented as the mean ± s.e.m, and statistical differences were calculated using one-way ANOVA. (C) Western blotting of DLST, IDH1, IDH2, and LDHA in the same three T-ALL cell lines transduced with shLuciferase or shDLST hairpins. Relative protein to ACTIN ratios are shown at the bottom of each western blotting panel. * p < 0.05, ** p < 0.01, *** p < 0.001, **** p < 0.0001. |
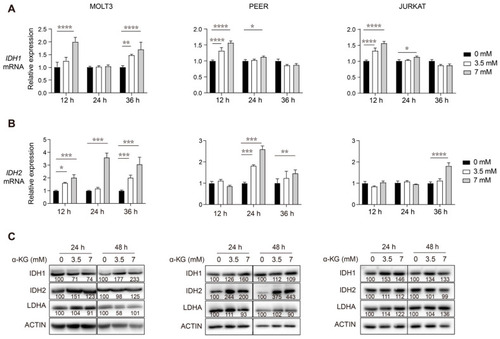
α-KG treatment of human T-ALL cells leads to increased transcript and protein levels of IDH1 and IDH2. (A,B) qRT-PCR analysis of IDH1 (A) and IDH2 (B) transcript levels at 12, 24, and 36 h post-treatment with 0, 3.5, or 7 mM of α-KG in human MOLT3, PEER, and JURKAT T-ALL cell lines. Relative fold change was analyzed using the 0 mM group as a control. The data are presented as the mean ± s.e.m, and statistical differences are calculated and normalized to the control, and determined by two-way ANOVA. (C) Western blotting of DLST, IDH1, IDH2, and LDHA in the same three T-ALL cell lines after 24 and 48 h of treatment with either 0, 3.5, or 7 mM of α-KG. Relative protein to ACTIN ratios are shown at the bottom of each western blotting panel. * p < 0.05, ** p < 0.01, *** p < 0.001, **** p < 0.0001. |
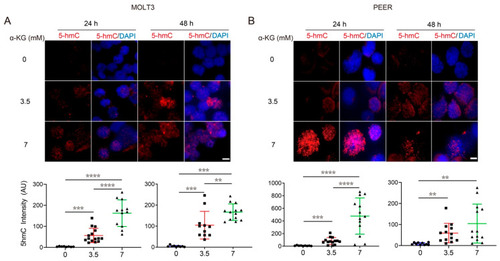
α-KG treatment in T-ALL cells increases DNA demethylation in a concentration-dependent manner. (A,B) 5hmC staining in MOLT3 (A) and PEER (B) cells after 24 and 48 h of treatment with 0, 3.5, or 7 mM of α-KG. DAPI (blue) counterstaining indicates the intranuclear location. The quantification of relative 5hmC fluorescence (red) is presented as the mean ± s.e.m., and an unpaired two-tailed t-test is used for statistical analysis. Scale bar = 10 μm. ** p < 0.01, *** p < 0.001, **** p < 0.0001. |
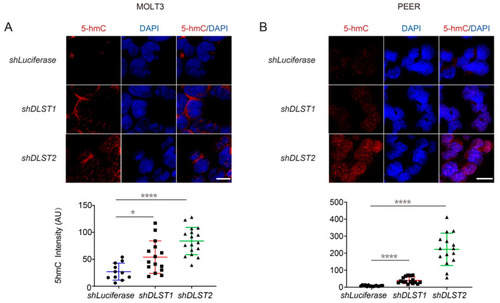
DLST inactivation significantly increases DNA demethylation in human T-ALL cells. (A,B) 5hmC staining in MOLT3 (A) and PEER (B) cells at 5 days after DLST knockdown, with Luciferase knockdown as the control and DAPI (blue) counterstain to demonstrate the intranuclear location of 5hmC staining (red). The quantification of relative 5hmC fluorescence intensity is presented as the mean ± s.e.m., and statistical differences are calculated using an unpaired two-tailed t-test. Scale bar = 10 μm. * p < 0.05, **** p < 0.0001. |
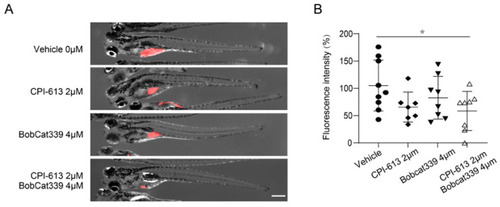
Combined inhibition of the TCA cycle and DNA methylation through CPI-613 and Bobcat 339 significantly decreases the tumor burden in zebrafish xenografts of human T-ALL. (A) Treatment of zebrafish xenografts with the TCA cycle inhibitor CPI-613 (2 μM) or TET1/2 inhibitor Bobcat339 (4 μM) resulted in a slightly decreased tumor burden, while combination treatment led to a significantly decreased tumor burden. (B) Quantification of the tumor fluorescence intensity in zebrafish xenografts is shown in (A). The data are presented as the mean ± s.e.m., and statistical differences are calculated using an unpaired two-tailed t-test with the vehicle as the control. Scale bar in (A) = 500 μm. * p < 0.05. |
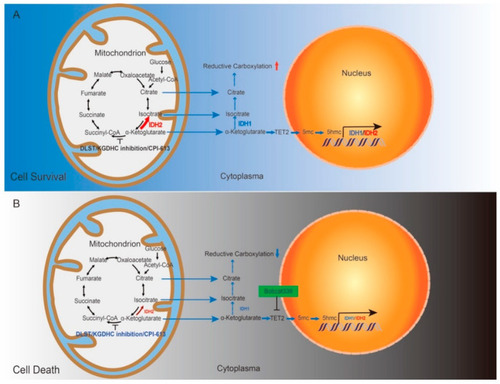
Schematic drawing of our working model. (A) Disrupting the TCA cycle alone leads to enhanced reductive carboxylation and T-ALL cell survival through TET-mediated demethylation and upregulation of IDH1 and IDH2. (B) Combined inhibition of the TCA cycle and TET-mediated demethylation kills T-ALL cells by decreasing the production of IDH1 and IDH2 and subsequently dampening reductive carboxylation. |