
|
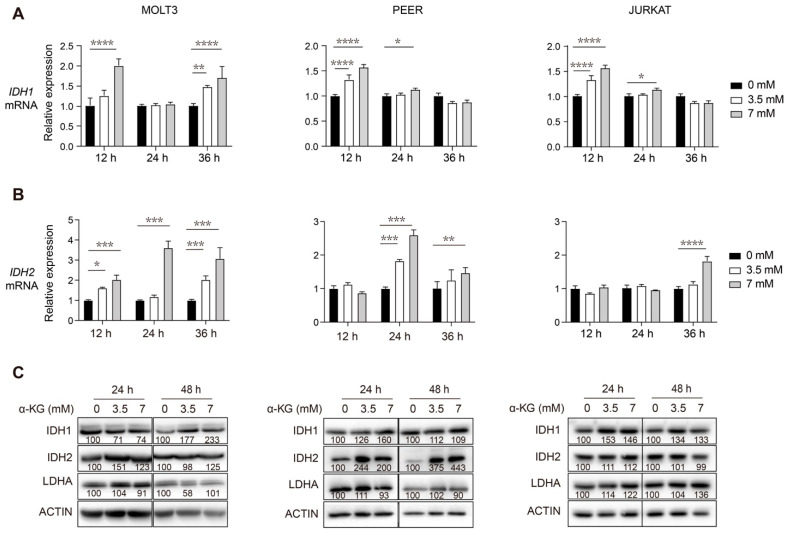
Fig. 3
α-KG treatment of human T-ALL cells leads to increased transcript and protein levels of IDH1 and IDH2. (A,B) qRT-PCR analysis of IDH1 (A) and IDH2 (B) transcript levels at 12, 24, and 36 h post-treatment with 0, 3.5, or 7 mM of α-KG in human MOLT3, PEER, and JURKAT T-ALL cell lines. Relative fold change was analyzed using the 0 mM group as a control. The data are presented as the mean ± s.e.m, and statistical differences are calculated and normalized to the control, and determined by two-way ANOVA. (C) Western blotting of DLST, IDH1, IDH2, and LDHA in the same three T-ALL cell lines after 24 and 48 h of treatment with either 0, 3.5, or 7 mM of α-KG. Relative protein to ACTIN ratios are shown at the bottom of each western blotting panel. * p < 0.05, ** p < 0.01, *** p < 0.001, **** p < 0.0001.