
Image
|
Figure Caption
Fig. 4
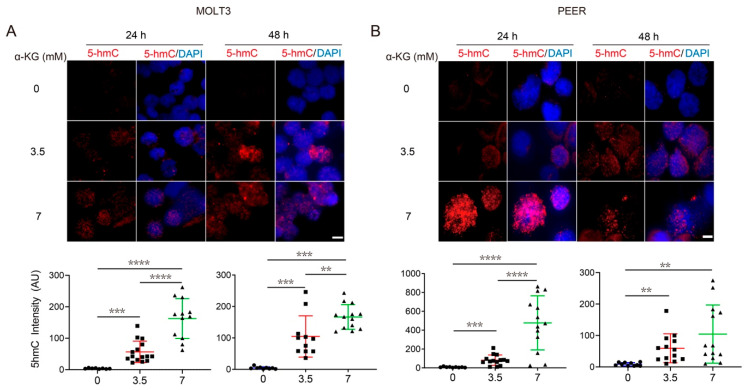
α-KG treatment in T-ALL cells increases DNA demethylation in a concentration-dependent manner. (A,B) 5hmC staining in MOLT3 (A) and PEER (B) cells after 24 and 48 h of treatment with 0, 3.5, or 7 mM of α-KG. DAPI (blue) counterstaining indicates the intranuclear location. The quantification of relative 5hmC fluorescence (red) is presented as the mean ± s.e.m., and an unpaired two-tailed t-test is used for statistical analysis. Scale bar = 10 μm. ** p < 0.01, *** p < 0.001, **** p < 0.0001.
Acknowledgments
This image is the copyrighted work of the attributed author or publisher, and
ZFIN has permission only to display this image to its users.
Additional permissions should be obtained from the applicable author or publisher of the image.
Full text @ Cancers