
Image
|
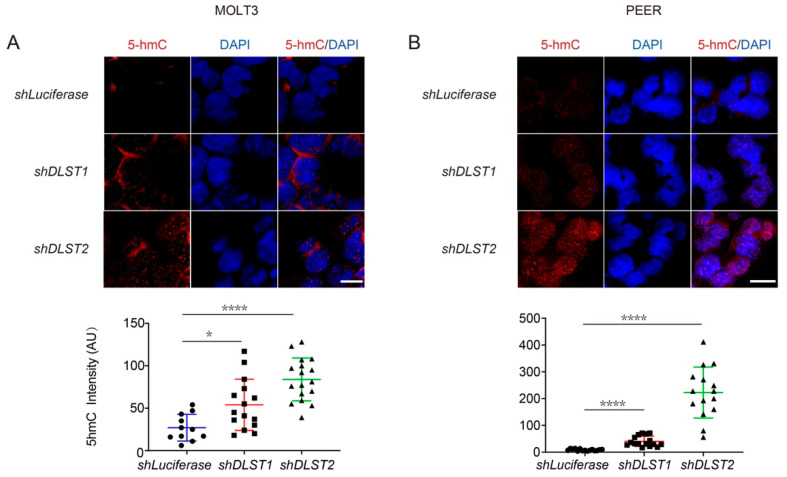
Figure Caption
Fig. 5
DLST inactivation significantly increases DNA demethylation in human T-ALL cells. (A,B) 5hmC staining in MOLT3 (A) and PEER (B) cells at 5 days after DLST knockdown, with Luciferase knockdown as the control and DAPI (blue) counterstain to demonstrate the intranuclear location of 5hmC staining (red). The quantification of relative 5hmC fluorescence intensity is presented as the mean ± s.e.m., and statistical differences are calculated using an unpaired two-tailed t-test. Scale bar = 10 μm. * p < 0.05, **** p < 0.0001.
Acknowledgments
This image is the copyrighted work of the attributed author or publisher, and
ZFIN has permission only to display this image to its users.
Additional permissions should be obtained from the applicable author or publisher of the image.
Full text @ Cancers