
- Title
-
Fish female-biased gene cyp19a1a leads to female antiviral response attenuation between sexes by autophagic degradation of MITA
- Authors
- Lu, L.F., Jiang, J.Y., Du, W.X., Wang, X.L., Li, Z.C., Zhou, X.Y., Zhang, C., Mou, C.Y., Chen, D.D., Li, Z., Zhou, L., Gui, J.F., Li, X.Y., Li, S.
- Source
- Full text @ PLoS Pathog.
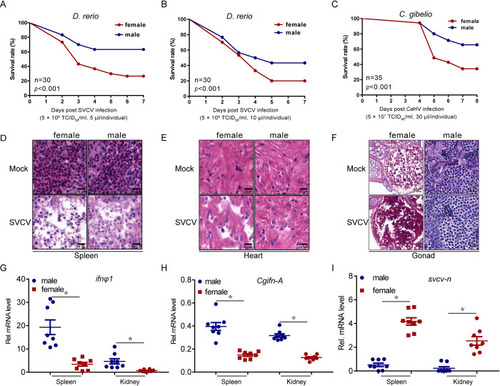
Sex-dependent fish susceptibility to mortality by SVCV infection.
(A-B) Survival (Kaplan-Meier Curve) of male and female zebrafish (n = 30 per group) at various days after i.p. injected with SVCV (5 × 10⁸ TCID50/ml, 5 μl or 10 μl/individual). (C) Wild-type Male and female gibel carp (n = 35 per group) were i.p. injected with CaHV (5 × 10⁷ TCID50/ml, 30 μl/individual) and the survival rate was calculated. (D-F) Microscopy of H&E-stained spleen (D), heart (E), and gonad (F) sections from male and female zebrafish treated with SVCV (5 × 10⁸ TCID50/ml, 5 μl/individual) for 72 h. (G) qPCR analysis of ifnφ1 mRNA in the spleen and kidney of male and female zebrafish (n = 8 per group) given i.p. injection of SVCV (5 × 10⁸ TCID50/ml, 5 μl/individual) for 48 h. Each dot point represents one independent biological replicate. *p < 0.05. (H) qPCR analysis of Cgifn-A mRNA in the spleen and kidney of male and female gibel carp (n = 8 per group) given i.p. injection of CaHV (5 × 10⁷ TCID50/ml, 30 μl/individual) for 48 h. Each dot point represents one independent biological replicate. *p < 0.05. (I) qPCR analysis of svcv-n mRNA in the spleen and kidney of zebrafish (n = 8 per group) given i.p. injection of SVCV (5 × 10⁸ TCID50/ml, 5 μl/individual) for 48 h. *p < 0.05. |
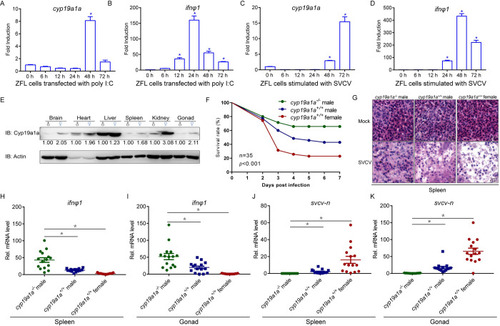
Loss of cyp19a1a protect zebrafish from virus infection.
(A-D) Cyp19a1a is induced by virus infection. qPCR detection of the mRNA levels of cyp19a1a and ifnφ1 on stimulation. ZFL cells were seeded in 3-cm2 dishes overnight and transfected with poly I:C (1 μg/ml) (A and B) or infected with SVCV (MOI = 1) (C and D). At the time points 6, 12, 24, 48, and 72 h, total RNAs were extracted for further qPCR assays. The relative transcriptional levels were normalized to the transcription of β-actin and represented as fold induction relative to the transcriptional level in control cells, which was set to 1. Data were expressed as mean ± SEM, n = 3. Asterisks indicate significant differences from control (*, p < 0.05). (E) IB analysis of endogenous Cyp19a1a protein level in the brain, heart, liver, spleen, kidney, and gonad of male and female zebrafish (n = 3 per group). (F) Survival (Kaplan-Meier Curve) of cyp19a1a-/- male, cyp19a1a+/+ male, and cyp19a1a+/+ female zebrafish (n = 35 per group) at various days after i.p. injected with SVCV (5 × 10⁸ TCID50/ml, 5 μl/individual). (G) Microscopy of H&E-stained spleen section from cyp19a1a-/- male, cyp19a1a+/+ male, and cyp19a1a+/+ female zebrafish treated with SVCV (5 × 10⁸ TCID50/ml, 5 μl/individual) for 72 h. (H-K) qPCR analysis of ifnφ1 and svcv-n mRNA in the spleen and gonad of cyp19a1a-/- male, cyp19a1a+/+ male, and cyp19a1a+/+ female zebrafish (n = 15 per group) given i.p. injection of SVCV (5 × 10⁸ TCID50/ml, 5 μl/individual) for 48 h. Each dot point represents one independent biological replicate. *p < 0.05. |
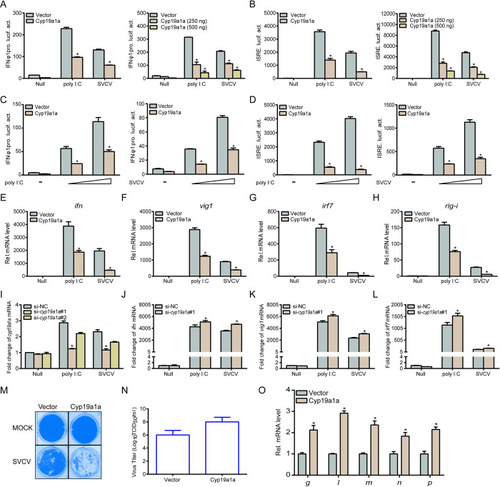
Overexpression of Cyp19a1a inhibits IFN induction and attenuates the cellular antiviral response.
(A-D) Transfected with 250 ng IFNφ1pro (A and C) or ISRE-Luc (B and D) and 25 ng pRL-TK, plus Cyp19a1a-Flag (250 ng or 250/500 ng) or pCMV-Tag2C (control vector). Cells were transfected with poly I:C (0.5 μg or 0.5/1 μg), or treated with SVCV (MOI = 1 or 1/10). Luciferase activities were monitored. The promoter activity is presented as relative light units (RLU) normalized to Renilla luciferase activity. (E-H) Cyp19a1a suppresses the expression of epc ifn (E), epc vig1 (F), epc irf7 (G), and epc rig-i (H) induced by poly I:C or SVCV. Cells were transfected with 2 μg Cyp19a1a-Flag and transfected with poly I:C (2 μg) or treated with SVCV (MOI = 1) at 24 h post-transfection. Total RNAs were extracted for further qPCR assays. (I) Transfected with 100 nM si-cyp19a1a#1, si-cyp19a1a#2, or si-NC (negative control). At 24 h post-transfection, the cells were transfected with poly I:C (2 μg) or treated with SVCV (MOI = 1), total RNAs were extracted to examine the transcriptional levels of cyp19a1a. (J-L) EPC cells were transfected with 100 nM si-NC or si-cyp19a1a#1. At 24 h post-transfection, cells were untreated or transfected with poly I:C or treated with SVCV for 24 h before qPCR analysis was performed. The relative transcriptional levels were normalized to the transcription of β-actin and represented as fold induction relative to the transcriptional level in control cells, which was set to 1. (M and N) Transfected with 0.5 μg Cyp19a1a-Flag, at 24 h post-transfection, EPC cells were infected with SVCV (MOI = 0.001) for 48 h. Then, cells were fixed and stained (M). The viral titer of the culture supernatants from the cells infected with SVCV was measured according to the method of Reed and Muench (N). (O) Transfected with 2 μg of Cyp19a1a-Flag, at 24 h post-transfection, EPC cells were infected with SVCV (MOI = 1), total RNAs were extracted for further qPCR assays. The relative transcriptional levels were normalized to the transcriptional level of the β-actin gene and were represented as fold induction relative to the transcriptional level in control cells, which was set to 1. Data were expressed as mean ± SEM, n = 3. Asterisks indicate significant differences from control values (*, p < 0.05). |
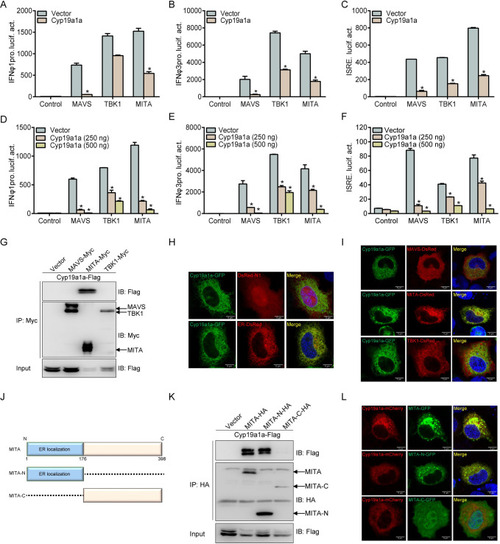
Cyp19a1a interacts with and blocks MITA-mediated IFN activation.
(A-F) Co-transfected with MAVS-, TBK1-, MITA-expressing plasmid and empty vector or Cyp19a1a-Flag (250 ng or 250/500 ng), plus IFNφ1pro-Luc (A and D) or IFNφ3pro-Luc (B and E) or ISRE-Luc (C and F) at the ratio of 1:1:1, pRL-TK was used as a control. At 24 h post-transfection, cells were lysed for luciferase activity detection. Data were expressed as mean ± SEM, n = 3. Asterisks indicate significant differences from control (*, p < 0.05). (G) EPC cells were transfected with the indicated plasmids (5 μg each). After 24 h, cell lysates were immunoprecipitated (IP) with anti-Myc affinity gel. Then the immunoprecipitates and WCLs were analyzed by IB with the anti-Myc and anti-Flag Abs, respectively. (H and I) EPC cells were co-transfected with 1 μg Cyp19a1a-GFP plus 1 μg empty vector, ER-DsRed (H) and MAVS-DsRed/TBK1-DsRed/MITA-DsRed (I). After 24 h, the cells were fixed and subjected to confocal microscopy analysis. Green signals represent overexpressed Cyp19a1a, red signals represent overexpressed ER or RLRs. The yellow staining in the merged image indicates the colocalization of Cyp19a1a and ER or MITA (original magnification 63×; oil immersion objective). Scale bar, 10 μm. (J) Schematic representation of full-length MITA and two mutants (MITA-N containing the ER localization domain and MITA-C containing the C-terminal 222 amino acids). (K) EPC cells were co-transfected with the indicated plasmids (5 μg each). After 24 h, cell lysates were IP with anti-HA affinity gel. Then the immunoprecipitates and WCLs were analyzed by IB with the indicated Abs. (L) EPC cells were co-transfected with 1 μg Cyp19a1a-mCherry plus 1 μg MITA-GFP, MITA-N-GFP, or MITA-C-GFP. After 24 h, the cells were fixed and subjected to confocal microscopy analysis. Red signals represent overexpressed Cyp19a1a, green signals represent overexpressed MITA and its mutants. The yellow staining in the merged image indicates the colocalization of Cyp19a1a and MITA-N (original magnification 63×; oil immersion objective). Scale bar, 10 μm. All experiments were repeated for at least three times with similar results. |
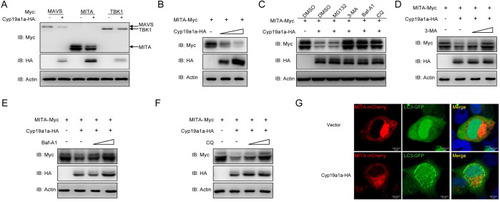
Cyp19a1a mediates degradation of MITA via the autophagy pathway.
(A and B) EPC cells were co-transfected with 1 μg Cyp19a1a-HA and 1 μg empty vector, MAVS-Myc, MITA-Myc, or TBK1-Myc (A), or 1 μg MITA-Myc plus Cyp19a1a-HA (1 or 2 μg) or 2 μg empty vector (B) for 24 h. The cell lysates were subjected to IB with anti-Myc, anti-HA, and anti-β-actin Abs. (C) EPC cells were co-transfected the indicated plasmids. At 18 h post-transfection, the cells were treated with DMSO, MG132 (20 μM), 3-MA (2 mM), Baf-A1 (100 nM), or CQ (100 μM) for 6 h. The cell lysates were subjected to IB with the indicated Abs. (D-F) EPC cells were co-transfected the indicated plasmids. At 18 h post-transfection, the cells were treated with 3-MA (1 or 2 mM), Baf-A1 (50 or 100 nM), or CQ (50 or 100 μM) for 6 h. Then, the cells were harvested for IB with the indicated Abs. (G) EPC cells were co-transfected with 1 μg Cyp19a1a-HA or pCMV-HA plus 1 μg MITA-mCherry and 1 μg LC3-GFP. After 24 h, the cells were fixed and observed by confocal microscopy. Red signals represent overexpressed MITA, green signals represent overexpressed LC3 or GFP-LC3 positive autophagosome accumulation (original magnification 63×; oil immersion objective). Scale bar, 10 μm. All experiments were repeated for at least three times with similar results. |
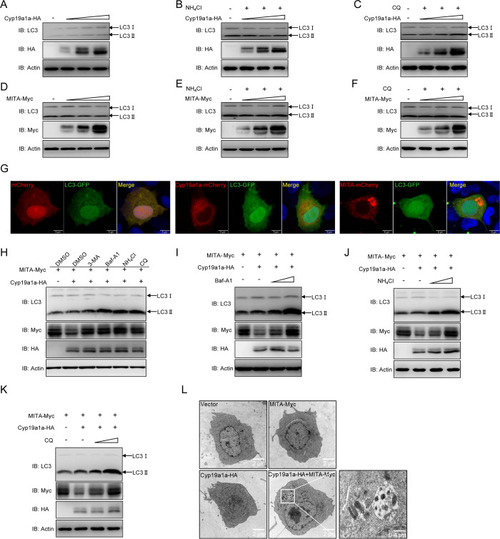
Co-transfection of Cyp19a1a and MITA triggers autophagy.
(A-F) EPC cells were transfected with Cyp19a1a-HA (0.5, 1, or 2 μg) (A-C) or MITA-Myc (0.5, 1, or 2 μg) (D-F). At 18 h post-transfection, the cells were treated with DMSO, NH4Cl (20 mM), or CQ (100 μM) for 6 h. Then, the cells were harvested for IB with the indicated Abs. (G) EPC cells were co-transfected with 1 μg pCS2-mCherry, Cyp19a1a-mCherry, or MITA-mCherry plus 1 μg LC3-GFP. After 24 h, the cells were fixed and observed by confocal microscopy. Red signals represent overexpressed Cyp19a1a or MITA, green signals represent overexpressed LC3 (original magnification 63×; oil immersion objective). Scale bar, 10 μm. (H) EPC cells were co-transfected the indicated plasmids. At 18 h post-transfection, the cells were treated with DMSO, 3-MA (2 mM), Baf-A1 (100 nM), NH4Cl (20 mM), or CQ (100 μM) for 6 h. The cell lysates were subjected to IB with the anti-LC3, anti-Myc, anti-HA, and anti-β-actin Abs, respectively. (I-K) EPC cells were co-transfected the indicated plasmids. At 18 h post-transfection, the cells were treated with DMSO, Baf-A1 (50 or 100 nM), NH4Cl (10 or 20 mM), or CQ (50 or 100 μM) for 6 h. The cell lysates were subjected to IB with the indicated Abs. (L) EPC cells were transfected with indicated plasmids for 24 h. Then the cells were analyzed for autophagosome formation using a transmission electron microscope. Images on the right correspond to the squared zoomed images in each panel. Scale bar, 2 μm. |
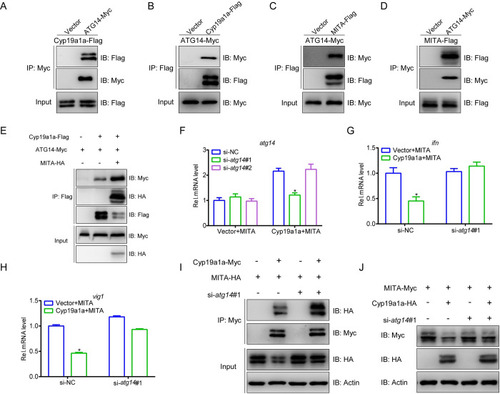
ATG14 is essential for Cyp19a1a mediated MITA autophagic degradation.
(A-D) EPC cells were transfected with the indicated plasmids (5 μg each). After 24 h, cell lysates were IP with anti-Myc or anti-Flag affinity gel. Then the immunoprecipitates and WCLs were analyzed by IB with the anti-Myc and anti-Flag Abs, respectively. (E) EPC cells were transfected with the indicated plasmids (4 μg each). After 24 h, cell lysates were IP with anti-Flag affinity gel. Then the immunoprecipitates and WCLs were analyzed by IB with the anti-Myc, anti-HA, and anti-Flag Abs, respectively. (F) EPC cells were transfected with 100 nM si-atg14#1, si-atg14#2, or si-NC (negative control). At 6 h post-transfection, the cells were transfected with 1.5 μg MITA-Myc plus 1.5 μg Cyp19a1a-Flag or empty vector. At 24 h post-transfection, total RNAs were extracted to examine the transcriptional levels of ATG14. (G and H) EPC cells were transfected with 100 nM si-NC or si-atg14#1. At 24 h post-transfection, cells were co-transfected with 1.5 μg MITA-Myc and 1.5 μg Cyp19a1a-Flag or empty vector for 24 h before qPCR analysis was performed. The relative transcriptional levels were normalized to the transcription of β-actin and represented as fold induction relative to the transcriptional level in control cells, which was set to 1. (I) EPC cells were transfected with 100 nM si-NC or si-atg14#1. After 24 h, the cells were transfected by the indicated plasmids (5 μg each) for 24 h. Cell lysates were IP with anti-Myc affinity gel. Then the immunoprecipitates and WCLs were analyzed by IB with the indicated Abs. (J) EPC cells were transfected with 100 nM si-NC or si-atg14#1. At 24 h post-transfection, cells were co-transfected with 1.5 μg MITA-Myc plus 1.5 μg Cyp19a1a-HA or empty vector for 24 h. The cell lysates were subjected to IB with anti-Myc, anti-HA, and anti-β-actin Abs. |
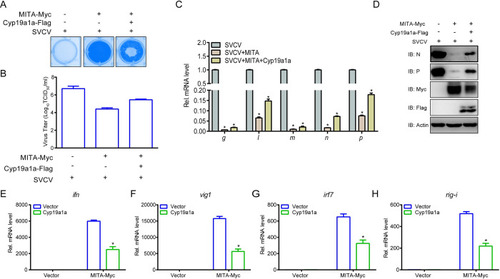
Cyp19a1a blocks MITA-mediated cellular antiviral response.
(A and B) EPC cells were transfected with 0.25 μg MITA-Myc and 0.25 μg Cyp19a1a-Flag or empty vector. At 24 h post-transfection, cells were infected with SVCV (MOI = 0.001) for 48 h. Then, cells were fixed with 4% PFA and stained with 1% crystal violet (A). Culture supernatants from the cells infected with SVCV were collected, and the viral titer was measured according to the method of Reed and Muench (B). (C) EPC cells were transfected with 1.5 μg Cyp19a1a-Flag or empty vector together with 1.5 μg MITA-Myc or empty vector. At 24 h post-transfection, cells were infected with SVCV (MOI = 1). After 24 h-infection, total RNAs were extracted to examine the mRNA levels of cellular g, l, m, n, and p. (D) The same samples were prepared similarly as described above for panel C. The lysates were detected by IB with anti-N, anti-P, anti-Myc, anti-Flag, and anti-β-actin Abs, respectively. (E-H) Overexpression of Cyp19a1a suppresses the expression of epc ifn (E), epc vig1 (F), epc irf7 (G), and epc rig-i (H) induced by MITA. EPC cells were transfected with 1.5 μg Cyp19a1a-Flag or empty vector together with 1.5 μg MITA-Myc or empty vector. At 24 h after transfection, total RNAs were extracted for further qPCR assays. The relative transcriptional levels were normalized to the transcriptional level of the β-actin gene and were represented as fold induction relative to the transcriptional level in the control cells, which was set to 1. Data were expressed as mean ± SEM, n = 3. Asterisks indicate significant differences from control values (*, p < 0.05). |