
|
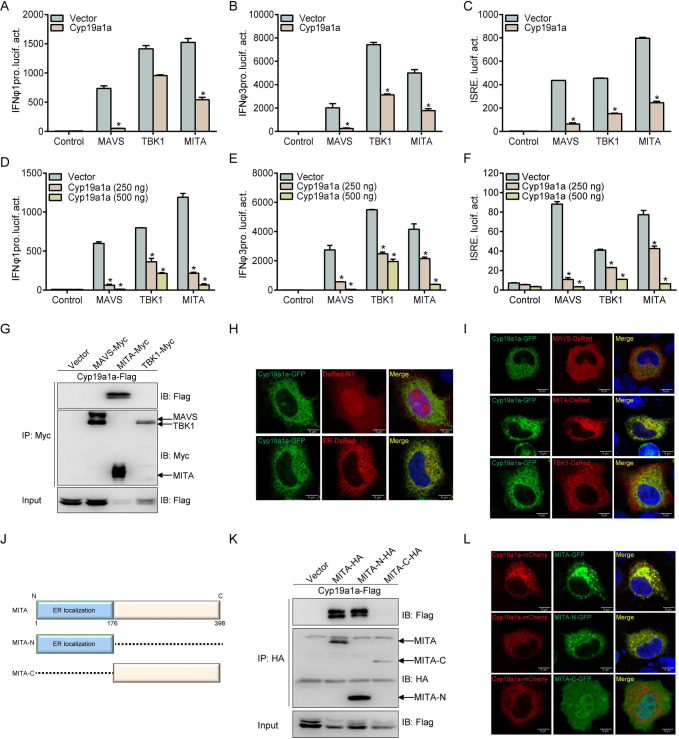
Fig. 4
(A-F) Co-transfected with MAVS-, TBK1-, MITA-expressing plasmid and empty vector or Cyp19a1a-Flag (250 ng or 250/500 ng), plus IFNφ1pro-Luc (A and D) or IFNφ3pro-Luc (B and E) or ISRE-Luc (C and F) at the ratio of 1:1:1, pRL-TK was used as a control. At 24 h post-transfection, cells were lysed for luciferase activity detection. Data were expressed as mean ± SEM, n = 3. Asterisks indicate significant differences from control (*, p < 0.05). (G) EPC cells were transfected with the indicated plasmids (5 μg each). After 24 h, cell lysates were immunoprecipitated (IP) with anti-Myc affinity gel. Then the immunoprecipitates and WCLs were analyzed by IB with the anti-Myc and anti-Flag Abs, respectively. (H and I) EPC cells were co-transfected with 1 μg Cyp19a1a-GFP plus 1 μg empty vector, ER-DsRed (H) and MAVS-DsRed/TBK1-DsRed/MITA-DsRed (I). After 24 h, the cells were fixed and subjected to confocal microscopy analysis. Green signals represent overexpressed Cyp19a1a, red signals represent overexpressed ER or RLRs. The yellow staining in the merged image indicates the colocalization of Cyp19a1a and ER or MITA (original magnification 63×; oil immersion objective). Scale bar, 10 μm. (J) Schematic representation of full-length MITA and two mutants (MITA-N containing the ER localization domain and MITA-C containing the C-terminal 222 amino acids). (K) EPC cells were co-transfected with the indicated plasmids (5 μg each). After 24 h, cell lysates were IP with anti-HA affinity gel. Then the immunoprecipitates and WCLs were analyzed by IB with the indicated Abs. (L) EPC cells were co-transfected with 1 μg Cyp19a1a-mCherry plus 1 μg MITA-GFP, MITA-N-GFP, or MITA-C-GFP. After 24 h, the cells were fixed and subjected to confocal microscopy analysis. Red signals represent overexpressed Cyp19a1a, green signals represent overexpressed MITA and its mutants. The yellow staining in the merged image indicates the colocalization of Cyp19a1a and MITA-N (original magnification 63×; oil immersion objective). Scale bar, 10 μm. All experiments were repeated for at least three times with similar results.