
|
Fig. 2
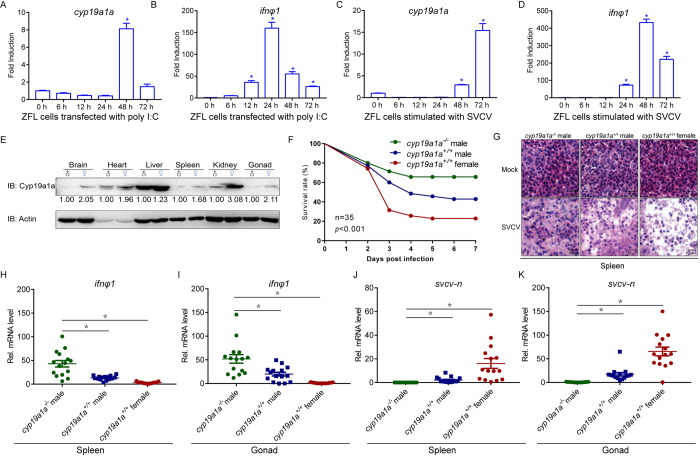
(A-D) Cyp19a1a is induced by virus infection. qPCR detection of the mRNA levels of cyp19a1a and ifnφ1 on stimulation. ZFL cells were seeded in 3-cm2 dishes overnight and transfected with poly I:C (1 μg/ml) (A and B) or infected with SVCV (MOI = 1) (C and D). At the time points 6, 12, 24, 48, and 72 h, total RNAs were extracted for further qPCR assays. The relative transcriptional levels were normalized to the transcription of β-actin and represented as fold induction relative to the transcriptional level in control cells, which was set to 1. Data were expressed as mean ± SEM, n = 3. Asterisks indicate significant differences from control (*, p < 0.05). (E) IB analysis of endogenous Cyp19a1a protein level in the brain, heart, liver, spleen, kidney, and gonad of male and female zebrafish (n = 3 per group). (F) Survival (Kaplan-Meier Curve) of cyp19a1a-/- male, cyp19a1a+/+ male, and cyp19a1a+/+ female zebrafish (n = 35 per group) at various days after i.p. injected with SVCV (5 × 10⁸ TCID50/ml, 5 μl/individual). (G) Microscopy of H&E-stained spleen section from cyp19a1a-/- male, cyp19a1a+/+ male, and cyp19a1a+/+ female zebrafish treated with SVCV (5 × 10⁸ TCID50/ml, 5 μl/individual) for 72 h. (H-K) qPCR analysis of ifnφ1 and svcv-n mRNA in the spleen and gonad of cyp19a1a-/- male, cyp19a1a+/+ male, and cyp19a1a+/+ female zebrafish (n = 15 per group) given i.p. injection of SVCV (5 × 10⁸ TCID50/ml, 5 μl/individual) for 48 h. Each dot point represents one independent biological replicate. *p < 0.05.