
|
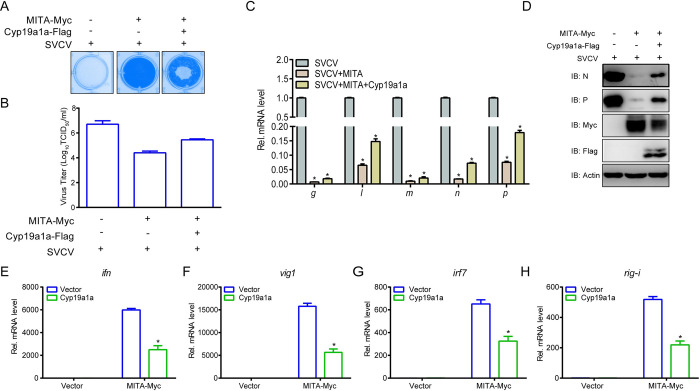
Fig. 8
(A and B) EPC cells were transfected with 0.25 μg MITA-Myc and 0.25 μg Cyp19a1a-Flag or empty vector. At 24 h post-transfection, cells were infected with SVCV (MOI = 0.001) for 48 h. Then, cells were fixed with 4% PFA and stained with 1% crystal violet (A). Culture supernatants from the cells infected with SVCV were collected, and the viral titer was measured according to the method of Reed and Muench (B). (C) EPC cells were transfected with 1.5 μg Cyp19a1a-Flag or empty vector together with 1.5 μg MITA-Myc or empty vector. At 24 h post-transfection, cells were infected with SVCV (MOI = 1). After 24 h-infection, total RNAs were extracted to examine the mRNA levels of cellular g, l, m, n, and p. (D) The same samples were prepared similarly as described above for panel C. The lysates were detected by IB with anti-N, anti-P, anti-Myc, anti-Flag, and anti-β-actin Abs, respectively. (E-H) Overexpression of Cyp19a1a suppresses the expression of epc ifn (E), epc vig1 (F), epc irf7 (G), and epc rig-i (H) induced by MITA. EPC cells were transfected with 1.5 μg Cyp19a1a-Flag or empty vector together with 1.5 μg MITA-Myc or empty vector. At 24 h after transfection, total RNAs were extracted for further qPCR assays. The relative transcriptional levels were normalized to the transcriptional level of the β-actin gene and were represented as fold induction relative to the transcriptional level in the control cells, which was set to 1. Data were expressed as mean ± SEM, n = 3. Asterisks indicate significant differences from control values (*, p < 0.05).