
Fig. 5
- ID
- ZDB-IMAGE-220705-57
- Publication
- Lu et al., 2022 - Fish female-biased gene cyp19a1a leads to female antiviral response attenuation between sexes by autophagic degradation of MITA
- All Figures
- Figures for Lu et al., 2022
|
Fig. 5
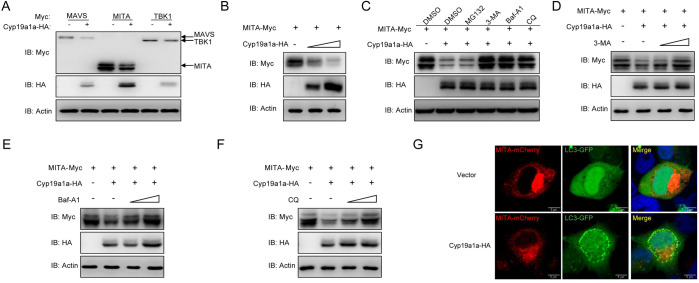
(A and B) EPC cells were co-transfected with 1 μg Cyp19a1a-HA and 1 μg empty vector, MAVS-Myc, MITA-Myc, or TBK1-Myc (A), or 1 μg MITA-Myc plus Cyp19a1a-HA (1 or 2 μg) or 2 μg empty vector (B) for 24 h. The cell lysates were subjected to IB with anti-Myc, anti-HA, and anti-β-actin Abs. (C) EPC cells were co-transfected the indicated plasmids. At 18 h post-transfection, the cells were treated with DMSO, MG132 (20 μM), 3-MA (2 mM), Baf-A1 (100 nM), or CQ (100 μM) for 6 h. The cell lysates were subjected to IB with the indicated Abs. (D-F) EPC cells were co-transfected the indicated plasmids. At 18 h post-transfection, the cells were treated with 3-MA (1 or 2 mM), Baf-A1 (50 or 100 nM), or CQ (50 or 100 μM) for 6 h. Then, the cells were harvested for IB with the indicated Abs. (G) EPC cells were co-transfected with 1 μg Cyp19a1a-HA or pCMV-HA plus 1 μg MITA-mCherry and 1 μg LC3-GFP. After 24 h, the cells were fixed and observed by confocal microscopy. Red signals represent overexpressed MITA, green signals represent overexpressed LC3 or GFP-LC3 positive autophagosome accumulation (original magnification 63×; oil immersion objective). Scale bar, 10 μm. All experiments were repeated for at least three times with similar results.