
|
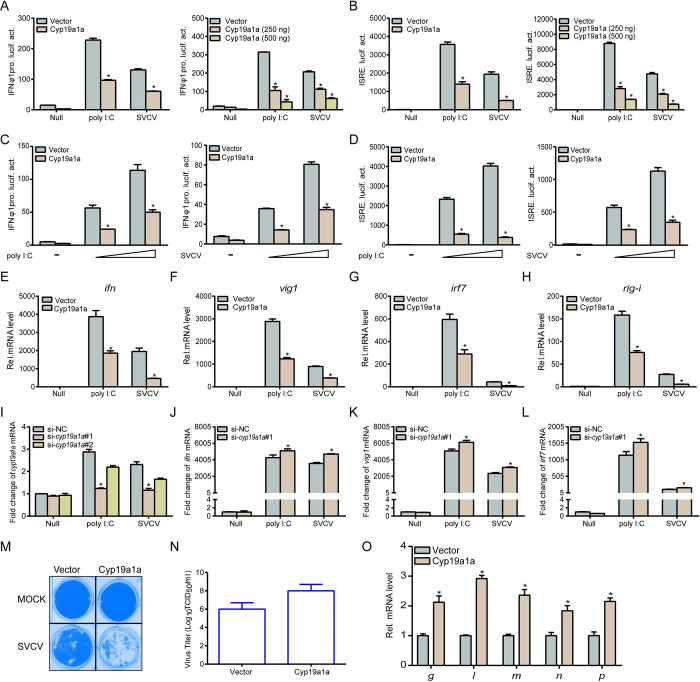
Fig. 3
(A-D) Transfected with 250 ng IFNφ1pro (A and C) or ISRE-Luc (B and D) and 25 ng pRL-TK, plus Cyp19a1a-Flag (250 ng or 250/500 ng) or pCMV-Tag2C (control vector). Cells were transfected with poly I:C (0.5 μg or 0.5/1 μg), or treated with SVCV (MOI = 1 or 1/10). Luciferase activities were monitored. The promoter activity is presented as relative light units (RLU) normalized to Renilla luciferase activity. (E-H) Cyp19a1a suppresses the expression of epc ifn (E), epc vig1 (F), epc irf7 (G), and epc rig-i (H) induced by poly I:C or SVCV. Cells were transfected with 2 μg Cyp19a1a-Flag and transfected with poly I:C (2 μg) or treated with SVCV (MOI = 1) at 24 h post-transfection. Total RNAs were extracted for further qPCR assays. (I) Transfected with 100 nM si-cyp19a1a#1, si-cyp19a1a#2, or si-NC (negative control). At 24 h post-transfection, the cells were transfected with poly I:C (2 μg) or treated with SVCV (MOI = 1), total RNAs were extracted to examine the transcriptional levels of cyp19a1a. (J-L) EPC cells were transfected with 100 nM si-NC or si-cyp19a1a#1. At 24 h post-transfection, cells were untreated or transfected with poly I:C or treated with SVCV for 24 h before qPCR analysis was performed. The relative transcriptional levels were normalized to the transcription of β-actin and represented as fold induction relative to the transcriptional level in control cells, which was set to 1. (M and N) Transfected with 0.5 μg Cyp19a1a-Flag, at 24 h post-transfection, EPC cells were infected with SVCV (MOI = 0.001) for 48 h. Then, cells were fixed and stained (M). The viral titer of the culture supernatants from the cells infected with SVCV was measured according to the method of Reed and Muench (N). (O) Transfected with 2 μg of Cyp19a1a-Flag, at 24 h post-transfection, EPC cells were infected with SVCV (MOI = 1), total RNAs were extracted for further qPCR assays. The relative transcriptional levels were normalized to the transcriptional level of the β-actin gene and were represented as fold induction relative to the transcriptional level in control cells, which was set to 1. Data were expressed as mean ± SEM, n = 3. Asterisks indicate significant differences from control values (*, p < 0.05).